Worst Case Analysis Toolset - Сообщения
I have this setup as a snippet and put it at the top of each of my worksheets. I've devised my own system for creating functions and defining variables that allows me to automatically perform these types of analyses fairly quickly within SMath.
I have another set of snippets which I'll upload later that automatically compute some of the 3sigma tolerances for resistors and capacitors based on initial tolerance, temperature, and life.
WC_Analysis.sm (86,08 КиБ) скачан 1558 раз(а).
Here's a fixed version.
WC_Analysis.sm (88,35 КиБ) скачан 1584 раз(а).
WroteRealized I had an error in the RSS calculation. I forgot to take the final square root.
Here's a fixed version.
WC_Analysis.sm (88,35 КиБ) скачан 1584 раз(а).
Hello,
Thank you for your job.
I'm trying to use your toolset, and I have a strange result for the RSS because it's higher than the EVA.
EVA :

Rss :

WC_Analysis_FO058.sm (105,81 КиБ) скачан 1427 раз(а).
Did I make a mistake? Or it is a bug on the RSS function?
Another question :
On the "Defining Function", could it work if I had an "if statement" like :
If (P28V-VD) > Vz
0mA
Else
{P28V-VD-VZ}/R_LIM-I_CAP/B (actual define function)
Thank you, Emilien
RSS is a statistical analysis performed on Normal distributions. The RSS function I have written assumes that the the inputs are normal and that the μ of the normal function is the middle value in each input vector. This is generally how I define my inputs.
Then it determines the sigma based on the min/max values of the input. I have assumed in my RSS calc that the nominal value of the input may not fall directly in between the min/max. So I compute the sigma from nominal to max and nominal to min and take the maximum of that result when performing the RSS. This can result in solutions such as you are seeing.
I do this intentionally because an RSS analysis does not make sense when the input aren't normal. I could take the min/max of each input, calculate μ from that and then determine sigma, but if I define my inputs such that the middle value is truly the nominal or μ value, then the analysis will provide min/max results that may fall in between the worst case min/max, but aren't statistically accurate.
That being said, the only input in your function that is really lopsided is the P28V input. What you could do for the RSS is redfine the P28V input so that it's centered around middle value of 16 and 31.5 as shown below. Notice the nominal value has changed, but for RSS we really only care about the min/max. You still have to ask yourself if this is a meaningful result, however.
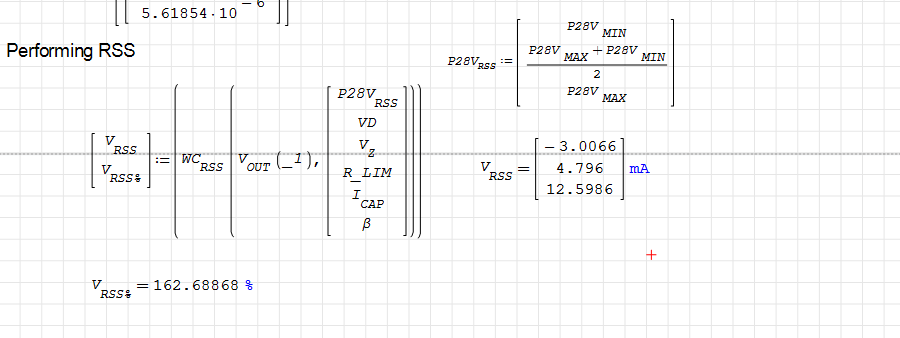
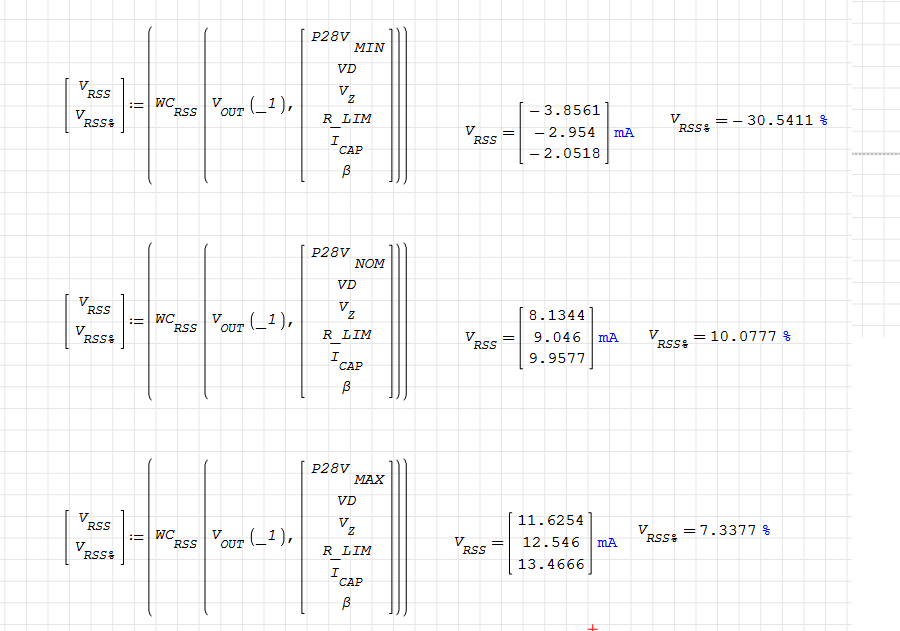
Another potential, and perhaps more meaningful alternative, is to fix the input voltage and perform the RSS analysis at each operating point of concern. Note that the minimum value calculated for P28V.MIN is still beyond the worst case value. So you also have to take that with a grain of salt.
WroteHi Emilien
RSS is a statistical analysis performed on Normal distributions. The RSS function I have written assumes that the the inputs are normal and that the μ of the normal function is the middle value in each input vector. This is generally how I define my inputs.
[...]
Thank you very much for your answer.
I understand the point, but before to see your message, I changed a little bit the RSS function.
I took the "diff_sign#" function from WC.DIFFEVA and I used it the sum the TOL.RSS positive and negative coefficient.

I changed my variable in order to have WCA_MIN equal to the nominal value, so not centered inputs at all.

EVA :

RSS :

I think it's not so stupid for not centered input vector ?
My another question :

Do you know why an if statement doesn't work like this one?
WC_Analysis_FO058.sm (149,87 КиБ) скачан 1395 раз(а).
Thank you, Emilien.
I am not sure how your code works because I am still getting familiar with Smath, I got an error on the Monte Carlo function
the last line= WC.MC(f(_1),I):WC.MC(f(_1),I#,1000), the error is "input string was not in the correct format" I assume is either a typo or something change on Smath that is not expecting the same format.
Also, do you have more examples with more complicated circuits that you can share? Transistor circuits, temperature changes.
Thank you.
WC_Analysis.sm (93,9 КиБ) скачан 2026 раз(а).
WroteSorry for the late reply.. There was an error in my definition of WC.MC(f(_1),I). It's fixed in the attached. To be honest, I don't use the Monte Carlo function much as Smath doesn't handle large number of calculations that well. For example just 100k iterations takes ~2.5 minutes on my machine. It's not ideal.
WC_Analysis.sm (93,9 КиБ) скачан 2026 раз(а).
Thanks!!!

WroteAlso, do you have more examples with more complicated circuits that you can share? Transistor circuits, temperature changes.
The sole laboratory that collects Global Warming data ... HadCRU.
Global Warming reached the peak 2010 [~ 0.8 °C]
From the stable reference period 1951 ... 1960
Since 2010, Global Warming has decreased ~ 0.75 °C.
Can you explain what you mean temperature changes ?
Cheers ... Jean.
Stat Treasury_8 Weibull FailureAnalysis.sm (25,03 КиБ) скачан 1361 раз(а).
is typical of Medic data [Mathsoft Collaboratory]
Many other PDF can be considered as applicable.
WWeibull is like Bible ...
Cheers ... Jean.
Stat Treasury_8 Weibull [log vraisemblance] Copy.sm (89,38 КиБ) скачан 1207 раз(а).
- Новые сообщения
- Нет новых сообщений