1 страниц (8 вхождений)
Problem Plotting Functions - Cannot plot function - Сообщения

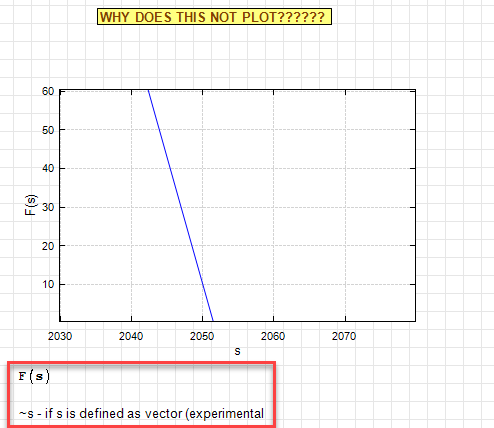
My Mathcad brain causes me to misunderstand some SMATH syntax. The is especially true in XY-Plots. I have created two function: F(s) and F1(s), which is discontinuous. If I redefine the functions as vectors and use augment to define the x-axis, the plots look okay. However, when I try to plot just the function, it does not work. These plots do not create a trace list as with the vector versions. F(s) just doesn’t plot. F1(s) also doesn’t plot, plus it gives an error.
In short, how do I plot simple functions?
Any help is appreciate, as always.
Plot Functions Question.sm (12,6 КиБ) скачан 1138 раз(а).
In short, how do I plot simple functions?
Any help is appreciate, as always.
Plot Functions Question.sm (12,6 КиБ) скачан 1138 раз(а).
Reg CurryLoveland, CO
Hi JReg. If I'm not wrong, just try to plot both with an undefined variable like F(so) and F1(so). The problem is that 's' is a vector.
Best regards.
Best regards.
Razonar,
Thanks much. That works.
Hope you don't mind if I have a second question.
In this attached sm file, I calculate the solution to an ODE with those two driving functions. Note the last integral in the solution. If I use F(s) it works; however, F1(s) is the function I want in the integral. For some reason it does not work. You will have to change F to F1 in that last integral to see that it fails.
Have I missed something obvious?
Thanks again.EMISSION REDUCTION Test.sm (28,71 КиБ) скачан 1194 раз(а).
Reg CurryLoveland, CO
It works if you define F1 as: F1(z):=(M*(z-tstart)+Fexp(tstart))*(z≤tfinish)+Fexp(tfix)*(z>tfinish)
i.e. using Boolean values: (z≤tfinish) = 1 if true, 0 if false, etc.
Don't know why SMath has a problem integrating if.. else.. structures.
i.e. using Boolean values: (z≤tfinish) = 1 if true, 0 if false, etc.
Don't know why SMath has a problem integrating if.. else.. structures.
Thanks. I’ll give that a try.
Reg CurryLoveland, CO
WroteIt works if you define F1 as: F1(z):=(M*(z-tstart)+Fexp(tstart))*(z≤tfinish)+Fexp(tfix)*(z>tfinish)
i.e. using Boolean values: (z≤tfinish) = 1 if true, 0 if false, etc.
Don't know why SMath has a problem integrating if.. else.. structures.
Thanks again. That really helped.
Reg CurryLoveland, CO
WroteDon't know why SMath has a problem integrating if.. else.. structures.
Smath integrates if/otherwise discontinuous functions.
Bolean must be specified completely, if NOT navigates.
Integrate Discontinuous.sm (36,51 КиБ) скачан 1183 раз(а).

Due to the implementation features, you can't use the function argument the same way you do it in Mathcad. The component allows you to use a vector variable if you add a tilde before the name.
Plot Functions Question (uni).sm (14,92 КиБ) скачан 1160 раз(а).
Plot Functions Question (uni).sm (14,92 КиБ) скачан 1160 раз(а).
Russia ☭ forever, Viacheslav N. Mezentsev
1 страниц (8 вхождений)
- Новые сообщения
- Нет новых сообщений