Unable to plot function using vectors

Unable to plot function using vectors - Сообщения

#1 Опубликовано: 09.07.2018 05:24:02
Banan

Banan

0 сообщений из 1 понравились пользователям.

Группа: User

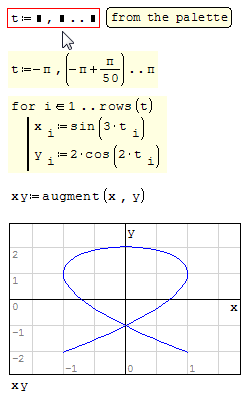
I would like to plot a function using vectors as in the tutorial (page 3) Tutorial

How to make vector like this x:=-pi,-pi+pi/20..pi? Comma i is my decimal sign so i guess i should use as argument separator ";".
When I write x:=-pi and press semicolon (comma i is my decimal sign) nothing happen...
javascript:__doPostBack('forum$ctl03$PostReply','')
#2 Опубликовано: 09.07.2018 05:38:55
Radovan Omorjan

Radovan Omorjan

325 сообщений из 2052 понравились пользователям.

Группа: Moderator

You should use the function range(2) or range(3). The same is obtained by choosing it from the Matrices palette.

Regards,
Radovan
When Sisyphus climbed to the top of a hill, they said: "Wrong boulder!"
#3 Опубликовано: 09.07.2018 07:28:26
Jean Giraud

Jean Giraud

983 сообщений из 6866 понравились пользователям.

Группа: User

Wrote

How to make vector like this x:=-pi,-pi pi/20..pi?


Just like Radovan has explained.

Plot.PNG
  • Новые сообщения Новые сообщения
  • Нет новых сообщений Нет новых сообщений