1 страниц (8 вхождений)
Plot SMath 0.91 vs. SMath 0.92 - Сообщения

Hi Andrey,
I test the new version (0.93) and found the same problem that version 0.92. This is the result from same file.
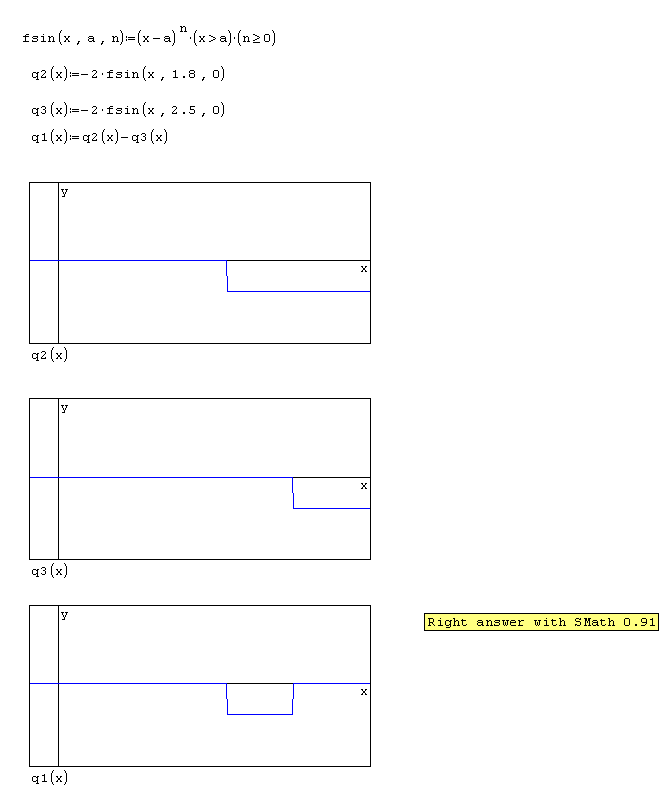
Plotting in 0.91:
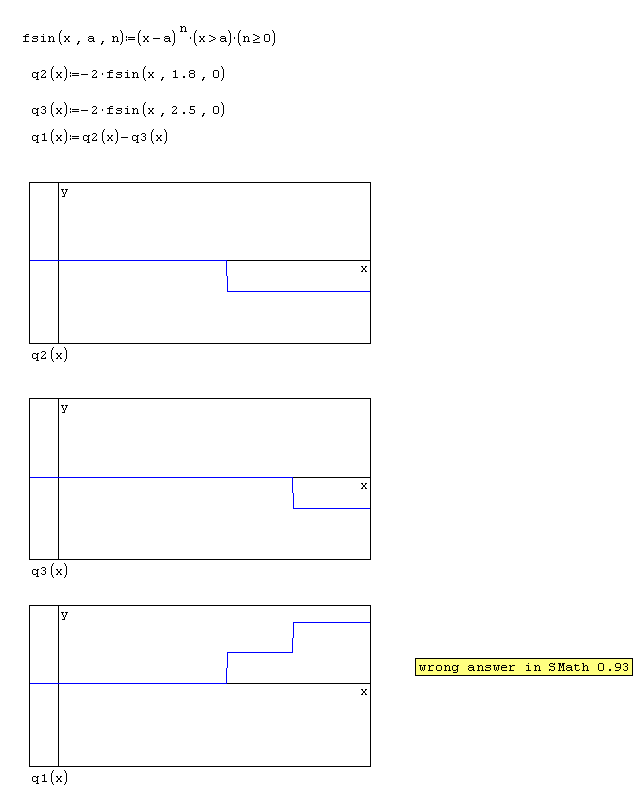
Plotting in 0.93:
Regards,
Oscar
I test the new version (0.93) and found the same problem that version 0.92. This is the result from same file.
Plotting in 0.91:
Plotting in 0.93:
Regards,
Oscar

325 сообщений из 2 052 понравились и 1 не понравились пользователям.
Группа: Moderator
Hello Oscar,
Here is the same file I reported it was wrong in v0.92 (the same post when you reported your problem).

It seems to me quite right in v0.93. It must have been something else regarding your problem. Can not see what's wrong at the moment.
Regards,
radovan
Here is the same file I reported it was wrong in v0.92 (the same post when you reported your problem).
It seems to me quite right in v0.93. It must have been something else regarding your problem. Can not see what's wrong at the moment.
Regards,
radovan
When Sisyphus climbed to the top of a hill, they said: "Wrong boulder!"

This was fixed in 0.93 (the reason was a bug regarding constants).
Regards.
Regards.
WroteThis was fixed in 0.93 (the reason was a bug regarding constants).
Regards.
Sorry, but in my post I show that problem persist in 0.93. It is not fixed.
Regards,
Oscar

WroteWroteThis was fixed in 0.93 (the reason was a bug regarding constants).
Regards.
Sorry, but in my post I show that problem persist in 0.93. It is not fixed.
Regards,
Oscar
same results of oscampo with Smath 0.93, win7
http://www.mediafire.com/?6uf36mq2xc0ykvi
If you like my plugins please consider to support the program buying a license; for personal contributions to me: paypal.me/dcprojects
WroteSorry, but in my post I show that problem persist in 0.93. It is not fixed.
Ok. I'll check it. Thank you.
Regards.
325 сообщений из 2 052 понравились и 1 не понравились пользователям.
Группа: Moderator
Hello,
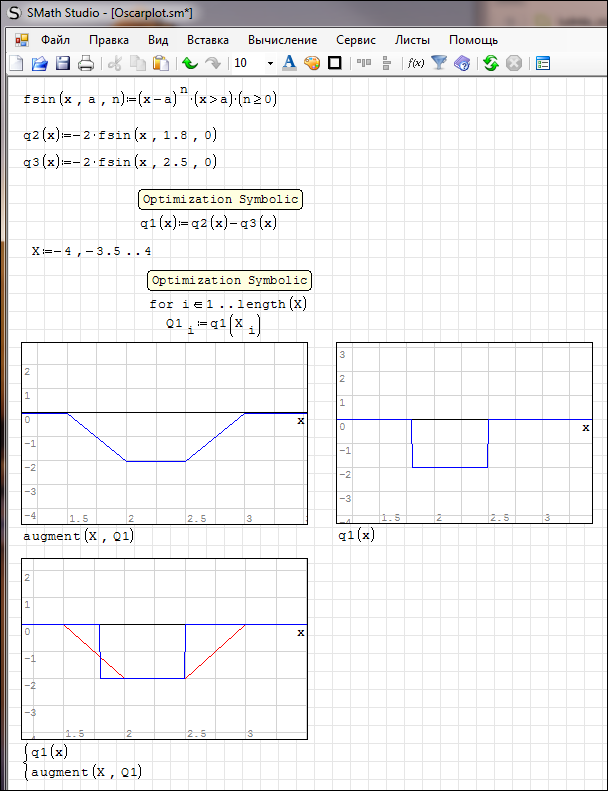
I think I found the problem. It seems it is again regarding Optimization
Look at the first picture please:

The blue line is a function of x, as in the Oscar's example. The red line is plotting two column vectors. I used the larger step just to see the difference. Either way the q1(x) has been calculated wrong.
Here is another picture with Numerical optimization applied on both q1(x) and for loop.

This time q1(x) has been calculated correctly. Unfortunatelly, the function plot is still wrong and I do not know how to change this.
Actually there is a way by using eval()

But another problem appeared. I can not see why the error in the third plot. Separate plot are possible but not the joined plot? Could someone try to reproduce or to explain this, please. Here is the file Oscarplot.sm
Regards,
Radovan
I think I found the problem. It seems it is again regarding Optimization
Look at the first picture please:
The blue line is a function of x, as in the Oscar's example. The red line is plotting two column vectors. I used the larger step just to see the difference. Either way the q1(x) has been calculated wrong.
Here is another picture with Numerical optimization applied on both q1(x) and for loop.
This time q1(x) has been calculated correctly. Unfortunatelly, the function plot is still wrong and I do not know how to change this.
Actually there is a way by using eval()
But another problem appeared. I can not see why the error in the third plot. Separate plot are possible but not the joined plot? Could someone try to reproduce or to explain this, please. Here is the file Oscarplot.sm
Regards,
Radovan
When Sisyphus climbed to the top of a hill, they said: "Wrong boulder!"
Fixed.
Regards.
Regards.
2 пользователям понравился этот пост
1 страниц (8 вхождений)
- Новые сообщения
- Нет новых сообщений