1 страниц (4 вхождений)
Plot does not plot waveform - Waveform does not always plot - suspect units - Сообщения
Hi Smath Team,
Great tool!
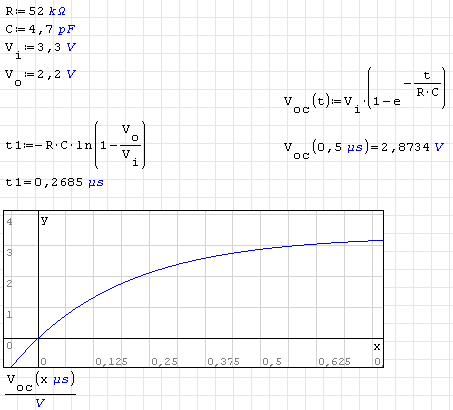
Sometimes a plot does not generate a waveform. I suspect it has something to do with units. Sometime when I start over, or change the order it works, but cannot figure it out. I have attached an recent example. Using 0.96 (build 4909).
Rob
SimpleRC.sm (5,72 КиБ) скачан 1112 раз(а).
Great tool!
Sometimes a plot does not generate a waveform. I suspect it has something to do with units. Sometime when I start over, or change the order it works, but cannot figure it out. I have attached an recent example. Using 0.96 (build 4909).
Rob
SimpleRC.sm (5,72 КиБ) скачан 1112 раз(а).

You just zoom on the chart that it concerns
Scale: if you roll your mouse wheel it zooms both axes together. If you hold 'control' keyboard key (CTRL) at the same time it just zooms the vertical axis;if you use the mouse wheel holding the 'shift' keyboard key (↑) it zooms the horizontal axis.
You can know more at this link
https://smath.com/wiki/Graphs.ashx
sergio
Scaling your plot by orders of magnitude with the mousewheel won't probably be fun. Better use appropriate scaling factors (units in your case)
Technische Mechanik mit SMath Studio: https://link.springer.com/book/10.1007/978-3-658-50592-9
1 страниц (4 вхождений)
- Новые сообщения
- Нет новых сообщений