1 страниц (7 вхождений)
Graphing Problem - Can't graph piece wise function -SOLVED - Сообщения
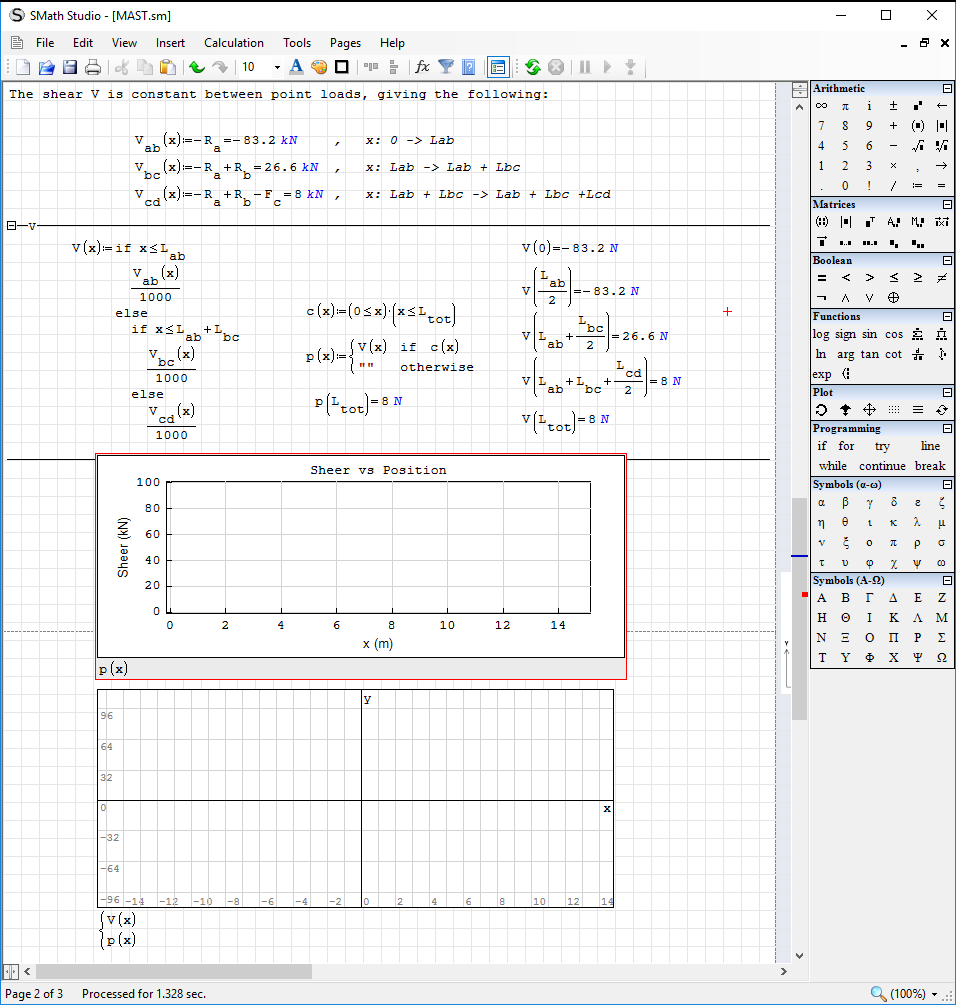
I've tried many ways from examples I have found on the internet, but I just can't get the graph to plot. What am I doing wrong?
Any help would be greatly appreciated.
[b]Foot note:
The problems are solved. The main problem was units; units must be correct through out. When using constants be sure the value also has units attached (1.5 m, not 1.5, for example). The second was that for the extended graph plugin there seems to be a limit on the levels of conditional functions you can call. I ended writing the function as a one line which worked:
Цитатаm(x)={((x≥0m)&(x
Hello Dave,
maybe a simple scaling problem? Your results are of magnitude 8 N, your plot is in [kN].
Try scaling the plot area with [Ctrl]+scroll wheel or [Shift]+ scroll wheel.
Hope this helps...
Regards, csb.
maybe a simple scaling problem? Your results are of magnitude 8 N, your plot is in [kN].
Try scaling the plot area with [Ctrl]+scroll wheel or [Shift]+ scroll wheel.
Hope this helps...
Regards, csb.
WroteI just can't get the graph to plot
Dave, please attach the work sheet.

Input units are needed... in the standard 2D plot, just use p(x*'m) / V(x*'m)
![2017-10-04 17_03_13-SMath Studio - [MAST.sm_].png](/ru-RU/files/Download/qvLPBV/2017-10-04-17_03_13-SMath-Studio---[MAST.sm_].png)
If you like my plugins please consider to support the program buying a license; for personal contributions to me: paypal.me/dcprojects
1. The X_Y plot does not take conditional
2. Quick plot does not take units [there is way to trick]
3. units removed from the two conditional ... plots !!!
Cheers... Jean
MAST.sm (1,43 МиБ) скачан 1069 раз(а).
2. Quick plot does not take units [there is way to trick]
3. units removed from the two conditional ... plots !!!
Cheers... Jean
MAST.sm (1,43 МиБ) скачан 1069 раз(а).
1 страниц (7 вхождений)
- Новые сообщения
- Нет новых сообщений