control Font Style of text on graphs? - It is possible control Font Style of text displayed on graphs? - Сообщения

Fonts on graphs.sm (5,22 КиБ) скачан 1392 раз(а).
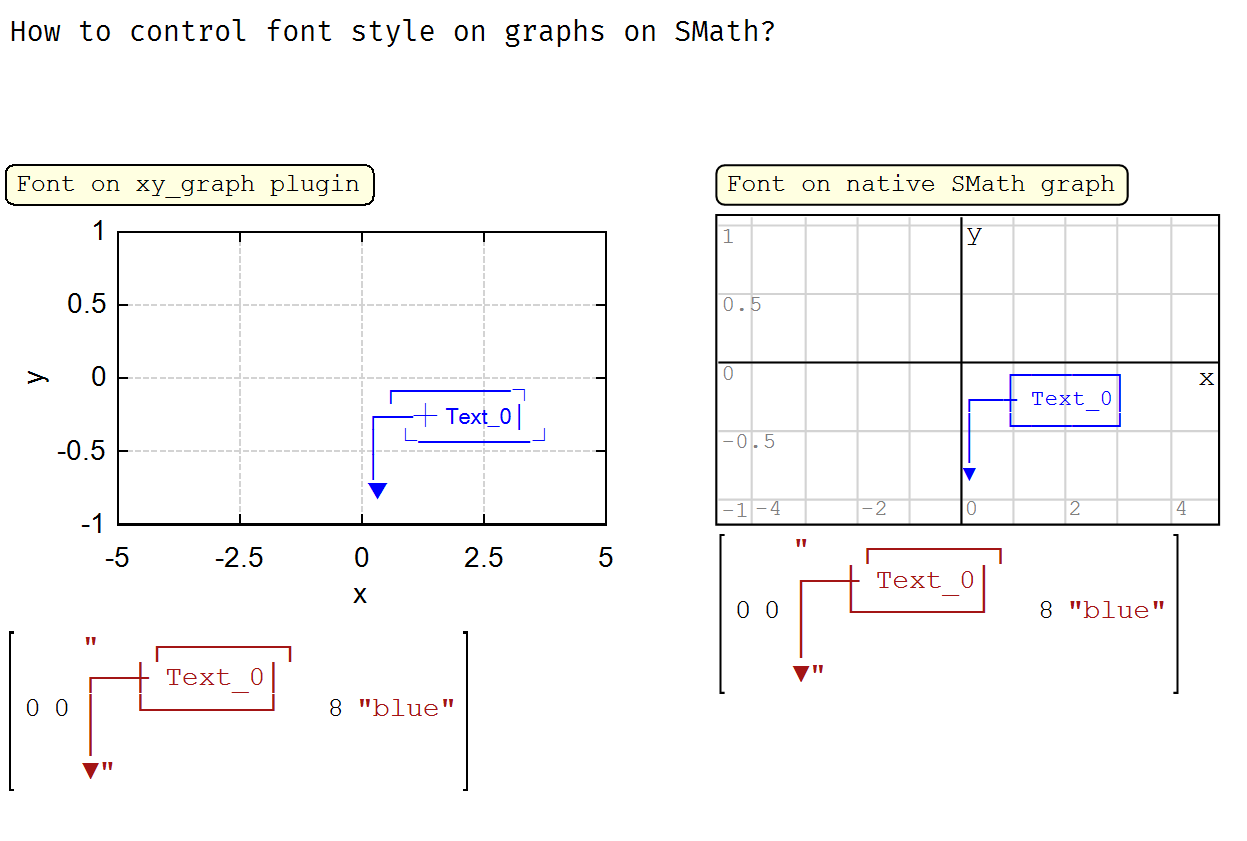
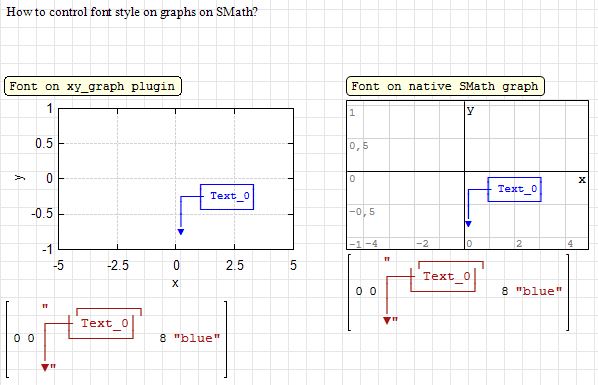
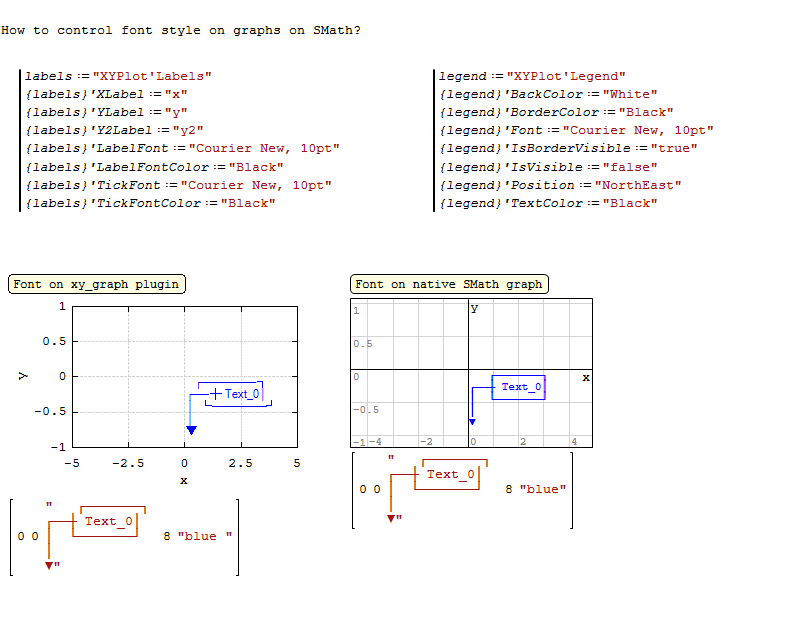
How to Control Font Style on Graphs in SMath?
Maybe is possible implement on x-y graph plugin?
best,
Oscar
probably my answer is not strictly related with your question but I see that you want to create like a callout with a textual part enclosed in a rectangle.
Just for the callout part probably can be of some help this post here
Then you can add a rectangular shape and overlap to it a label text always using the XY Plot Plugin.(Hoping that the textual part is not hidden by the rectangualr one .. but if the rectangle is not filled should be feasible the thing t least from a conceptual viewpoint)
Obviuosly it is a longer process despite your one .
Take care and best regards
Franco
WroteHi Oascar,
probably my answer is not strictly related with your question but I see that you want to create like a callout with a textual part enclosed in a rectangle.
Just for the callout part probably can be of some help this post here
Then you can add a rectangular shape and overlap to it a label text always using the XY Plot Plugin.(Hoping that the textual part is not hidden by the rectangualr one .. but if the rectangle is not filled should be feasible the thing t least from a conceptual viewpoint)
Obviuosly it is a longer process despite your one .
Take care and best regards
Franco
Thanks Franco,
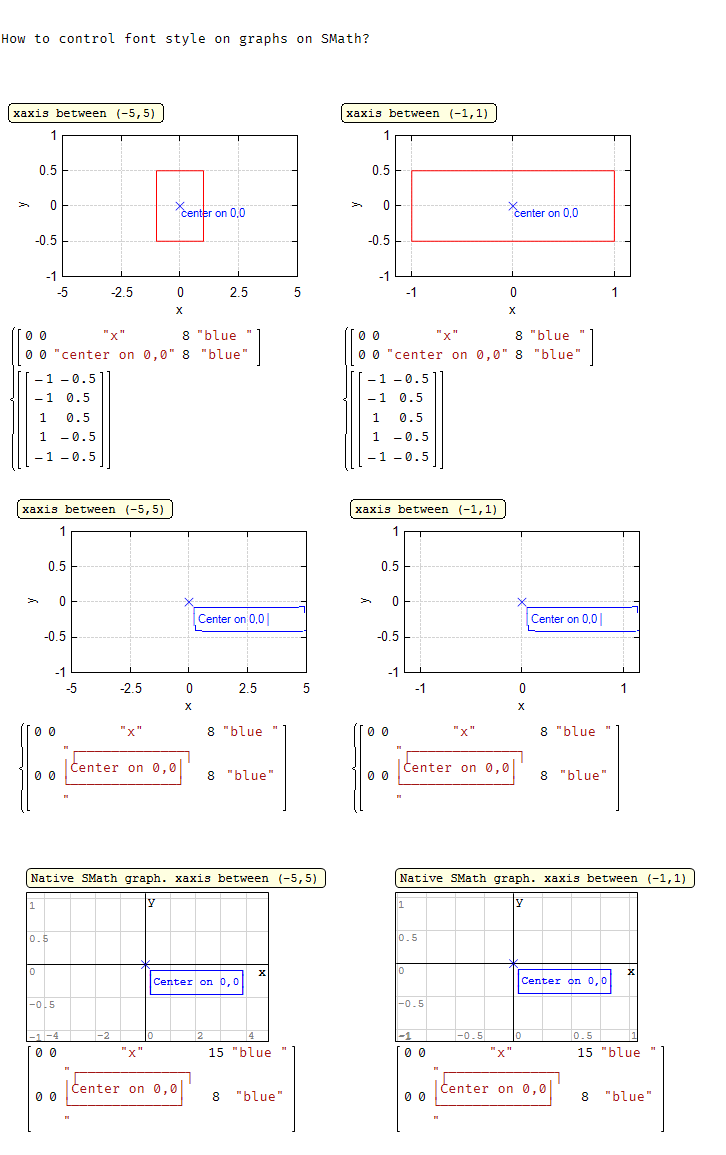
Your post about callouts on XY Plot plugin was my inspiration. The problem is that the text is independant of the zoom you apply on the graph and the lines defined by points ar totally dependant of the zoom. in this case, mix a rectangle and text will create a degenerate callout when somebody try to change the zoom on a graph:
Fonts on graphs 2.sm (17,07 КиБ) скачан 1361 раз(а).


WroteYou might have something related to the font family too? i.e. seems it isn't a monospaced font, that is a cornerstone in ascii drawings.
I have tested it with a freshly installed version of SMath and it is the same.
The point is that the text (monospaced) in the native SMath graphics is displayed correctly, but not in the graph plotted by the x-y graph plugin. There is no way to control which font is used for the text in the x-y plugin through the settings. It would be really amazing if you could choose which font you would like to use.
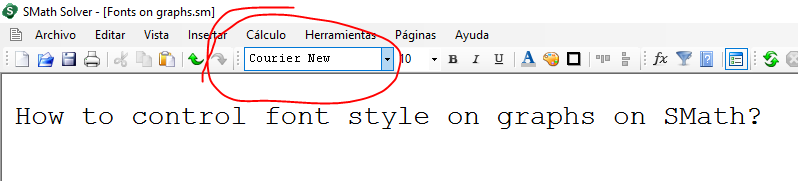
WroteX-Y Plot uses 'Courier' font family for text labels.
Font in Oscar screenshot is definetly not Courier. It might be possible that the font is not installed on Oscar PC? .NET overrides the requested typeface if not found (that's the reason behind the FontFamily.GenericMonospace/FontFamily.GenericSerif etc options to initialize a font).
WroteX-Y Plot uses 'Courier' font family for text labels.
...
Please,
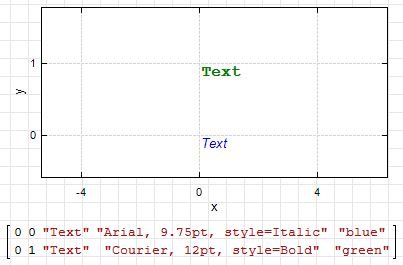
Can you change the font of text labels on settings and check if they really change the font inside the graph? I tried to do that but nothing happens, only can change font of axes, labels, legend, and, Title. Nothing of that affects the text inside the graph.
The only possibility to mitigate it is to define in a rigid way a drawing frame and ask the end user to avoid zooming ( it is probably a too restrictive approach ) .
Obviously if the usage of the documentation/program developed is for publishing or presentation purposes this issues are less important.
Other possibilities to write text labels is with a program/utilities from Razonar , If I remeber correctly they came from a Mathcad sheet conversion and don't know if the zooming issue is present in this program too.
Best regards
Franco
WroteWroteX-Y Plot uses 'Courier' font family for text labels.
Font in Oscar screenshot is definetly not Courier. It might be possible that the font is not installed on Oscar PC? .NET overrides the requested typeface if not found (that's the reason behind the FontFamily.GenericMonospace/FontFamily.GenericSerif etc options to initialize a font).
Here is a screenshot with courier font family (I had installed):
WroteHere is a screenshot with courier font family (I had installed):
I guessed so, since the built-in plot has a monospaced font.
What I mean is that if the Font in the plugin is initialized with a specific name (f.e. "Courier" ) and the actual font name is different (f.e. "Courier New" ) it migth not match (because are two similar but different fonts) and fall back to a standard font picked by the framework.
It is possible that you need the Courier (without new) font.
(like this - I don't have the simple "Courier" type too in Windows by default)
Файл не найден. Файл не найден.
WrotePlease,
Can you change the font of text labels on settings and check if they really change the font inside the graph? I tried to do that but nothing happens, only can change font of axes, labels, legend, and, Title. Nothing of that affects the text inside the graph.
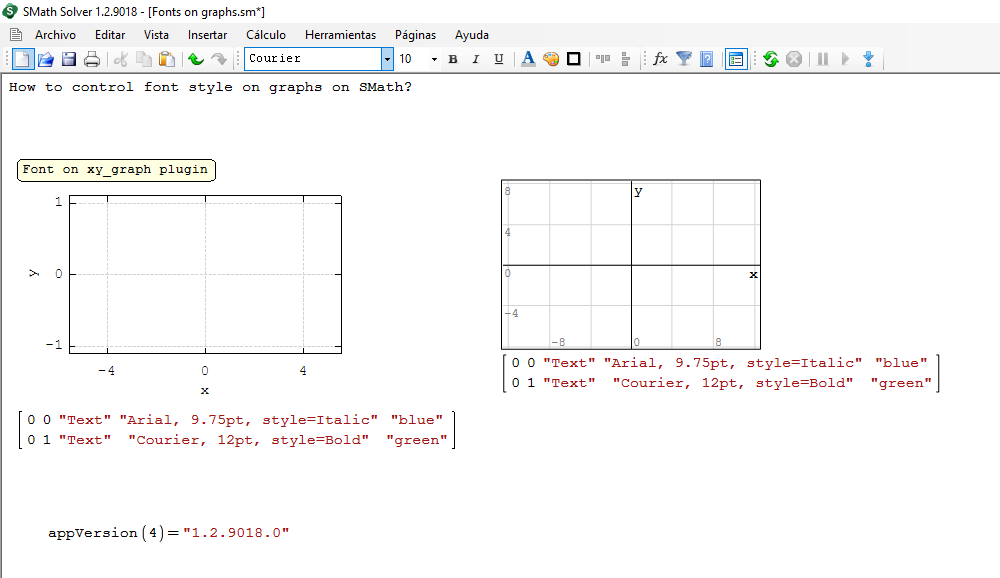
Something like that
It looks like the 2D Plot is using the "Courier New" font.
Wrote
Something like that
It looks like the 2D Plot is using the "Courier New" font.
I installed "Courier" font. Nothing happens... I tried on 3 different devices where I have installed SMath and I can't reproduce the same as your screenshot... (why?)
WroteNot so fast. This is a new feature. Only I have implemented it so far.
Ok...!!!
 I'm waiting for that!!
just for completeness and information this is the post from Alvaro I was referring to ,with it there are no zooming issues because the font is vectorial , if I remeber correctly there are 2 fonts family .
Probably in this case the limiting factor is the time involved to write something on the plotting area; make me wonder if it is possible to optimize the execution time saving the vector font table avoiding that it is recalculated each time the program starts and improving the assembly of the writing label from this table , for sure Alvaro can be of better help on this topic.
Take care and best regards
Franco

Since we are on the subject of text, one feature I would request is the ability to plot text directly onto the graph:
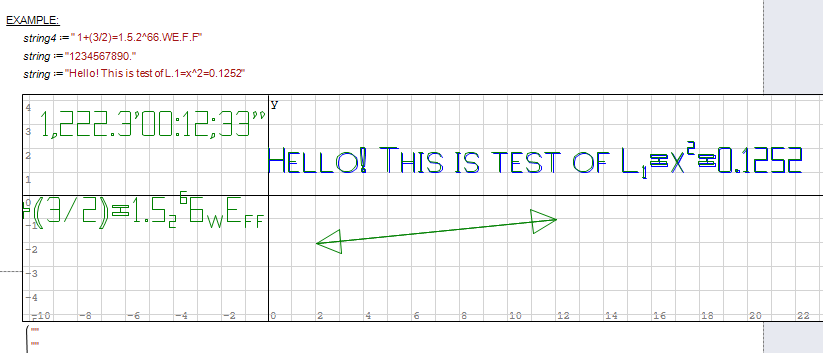
I use this technique for creating dimensions on screen (and by extension, leaders). I try to limit the native 'draw text on top of graph' as graph labels (things that don't require any specific zoom to look nice, like the USC Icon in AutoCAD).
The problem is that each letter needs to be mapped; there should be a way to convert a font into plot data, but I don't know how to go about that.
May this be of Good Help;
⚜ Kenny Lemens, P.E. ᵂᴵ
WroteHi Oscar,
just for completeness and information this is the post from Alvaro I was referring to ,with it there are no zooming issues because the font is vectorial , if I remeber correctly there are 2 fonts family .
Probably in this case the limiting factor is the time involved to write something on the plotting area; make me wonder if it is possible to optimize the execution time saving the vector font table avoiding that it is recalculated each time the program starts and improving the assembly of the writing label from this table , for sure Alvaro can be of better help on this topic.
Take care and best regards
Franco
About speeding up the script execution, you can use that file to generate a string (for faster copy and paste) and use this function to represent it. This is because there is no NaN in SMath, otherwise it would be much easier.
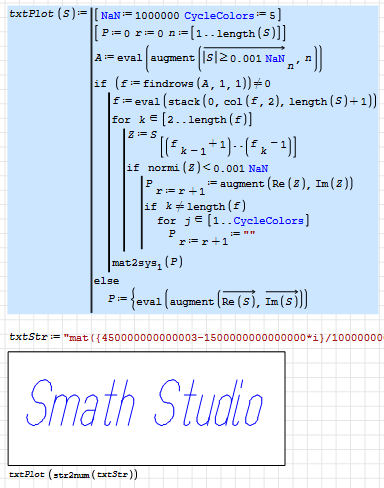
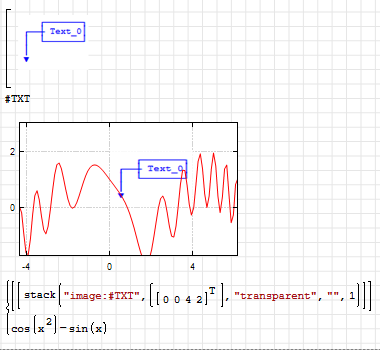
Another technique could be XYPlot's new image embedding functionality. Here I copied and pasted a clipping from Oscar's example, but you could just as well generate SVG text and pass it to XYPlot.
DrawingText - JustTheText.sm (38,46 КиБ) скачан 1397 раз(а).
Best regards.
Alvaro.
I imagine that is a the text string to plot but how has been created and from what ? Using part of the program you developed previously to draw text in XY Plot ? and however is fast this part not as the original program at least for me .
Best regards
Franco
WroteSorry Alvaro but what is txtStr ?
I imagine that is a the text string to plot but how has been created and from what ? Using part of the program you developed previously to draw text in XY Plot ? ...
You imagine well. It is from here:
DrawingText TXT.sm (325,19 КиБ) скачан 1405 раз(а).
Wrote... in XY Plot ?
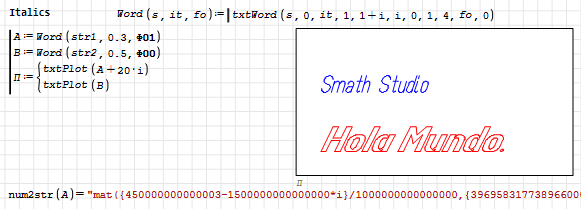
It is not designed for XYPlot, but for native SMath Plot, although it works in both. This version is for XYPlot, which can obviously include more options.
DrawingText - JustTheText XYPlot.sm (35,85 КиБ) скачан 1408 раз(а).
Wrote... and however is fast this part not as the original program at least for me .
Maybe in your system. You can see my timings in the original post, at left of the margin. It take more than one minute for the entire worksheet in my system. BTW, like in Microsoft Word or Adobe PDF: you can choose if you want to embed the fonts in the document or not.
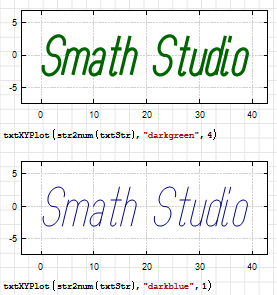
With this for include vectorial text in a graphic, there is no need to include the source in the document, with the fonts definitions and procedures to draw them; just a string and an auxiliary function, necessary because (I insist) SMath does not have NaN, because if it had, the function would not be necessary.
In any case, if Viacheslav includes the option to display scalable and orientable text in its plugin, this utility would almost lose all its meaning. Maybe just for some special effect.
Best regards.
Alvaro.
- Новые сообщения
- Нет новых сообщений