1 страниц (3 вхождений)
how to do semilog or loglog plot of discrete data - Сообщения
Hello all,
I need to do log-log and semilog plots of data in vectors.
I searched around and it seems Maxima would be the most flexible way to do it.
Can someone show me the correct syntax?
(I feel like a dummy ... )
TIA
I need to do log-log and semilog plots of data in vectors.
I searched around and it seems Maxima would be the most flexible way to do it.
Can someone show me the correct syntax?
(I feel like a dummy ... )
TIA
We have examples of:
1. log10 decades
2. logpts populate low region.
Utilities logpts Populate Quick.sm (14,43 КиБ) скачан 975 раз(а).
2D Plot Stem log10 DECADES Bode.sm (170,07 КиБ) скачан 1038 раз(а).
1. log10 decades
2. logpts populate low region.
Utilities logpts Populate Quick.sm (14,43 КиБ) скачан 975 раз(а).
2D Plot Stem log10 DECADES Bode.sm (170,07 КиБ) скачан 1038 раз(а).
WroteHello all,
I need to do log-log and semilog plots of data in vectors.
I searched around and it seems Maxima would be the most flexible way to do it.
Can someone show me the correct syntax?
(I feel like a dummy ... )
TIA
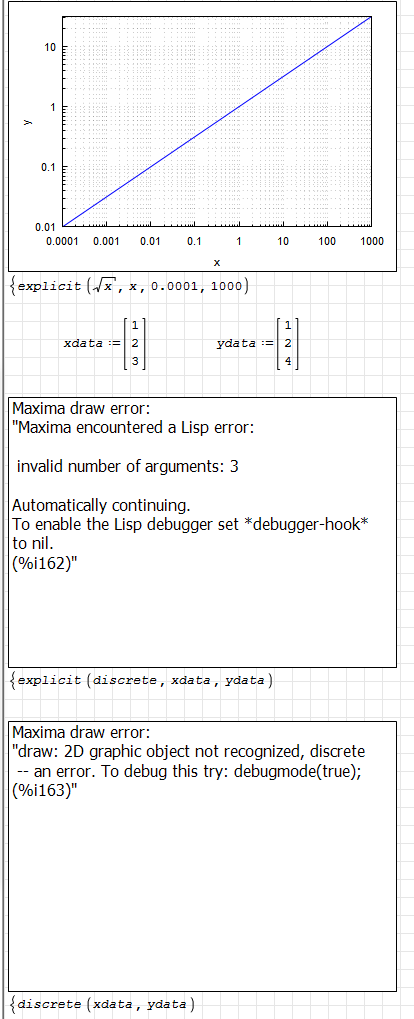
The command "discrete" isn't a valid draw command. Maxima has two ways of plotting, one using plot2d() and plot3d() and one using draw(). The Draw regions from the Maxima plugin as well as the functions Draw2D() and Draw3D() use the draw package, which is essentially an interface to gnuplot.
There is a lot of examples in the Samples>Maxima topic of the forum
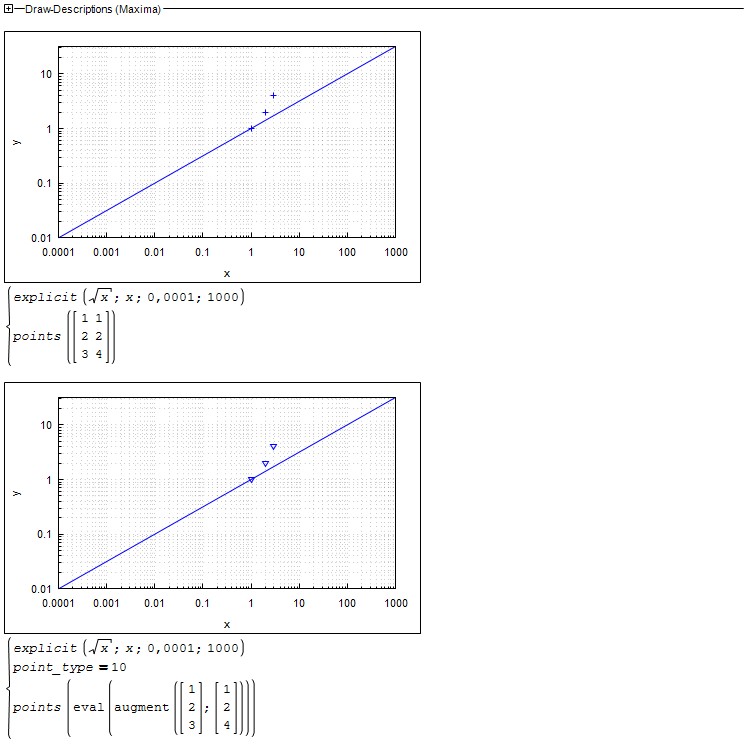
You want to use the command points(matrix), where matrix is a two-column matrix of x and y data.
In my pdf Handbuch you find a lot of example plots. In recent version it seems that the draw regions aren't as robust as the DrawD/3D() commands.
In the attachment you find the smath sheet generating the handbuch plots.
Draw2D3D.sm (481,77 КиБ) скачан 1027 раз(а).
Draw2D3D.pdf (3,95 МиБ) скачан 801 раз(а).
points1.sm (148,74 КиБ) скачан 965 раз(а).
Technische Mechanik mit SMath Studio: https://link.springer.com/book/10.1007/978-3-658-50592-9
1 страниц (3 вхождений)
- Новые сообщения
- Нет новых сообщений