how can I fill a matriX - Сообщения
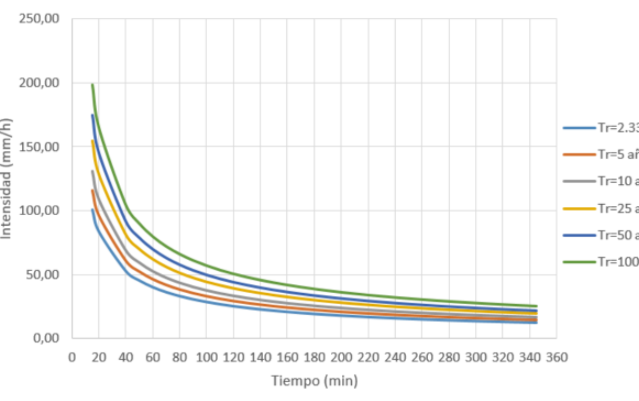
FINALLY I HAVE TO GRAPH IN THE X-AXIS THE VALUE OF "t" AND IN THE AXIS AND THE VALUES THAT I FIND OF "I" FOR EACH "T1, T2 ... T6". IS IT POSSIBLE THAT THE CURVES ARE IN THE SAME GRAPHIC? LIKE THIS
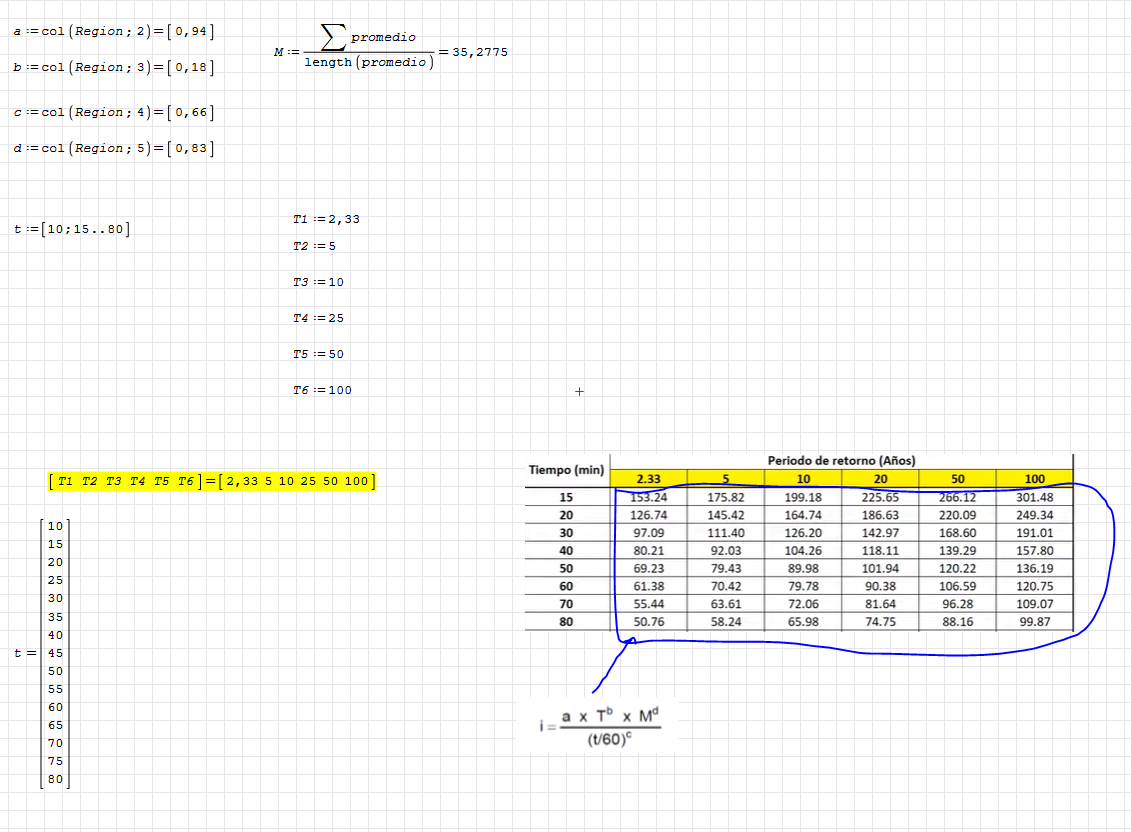
WroteHi, can someone help me with the solucion of this problem that i have, I need to create a matrix with the vector "t" in the first column and in the first row with the values of "T1, T2..T6", and the matrix has to be filled with the equation "I".
FINALLY I HAVE TO GRAPH IN THE X-AXIS THE VALUE OF "t" AND IN THE AXIS AND THE VALUES THAT I FIND OF "I" FOR EACH "T1, T2 ... T6". IS IT POSSIBLE THAT THE CURVES ARE IN THE SAME GRAPHIC? LIKE THIS
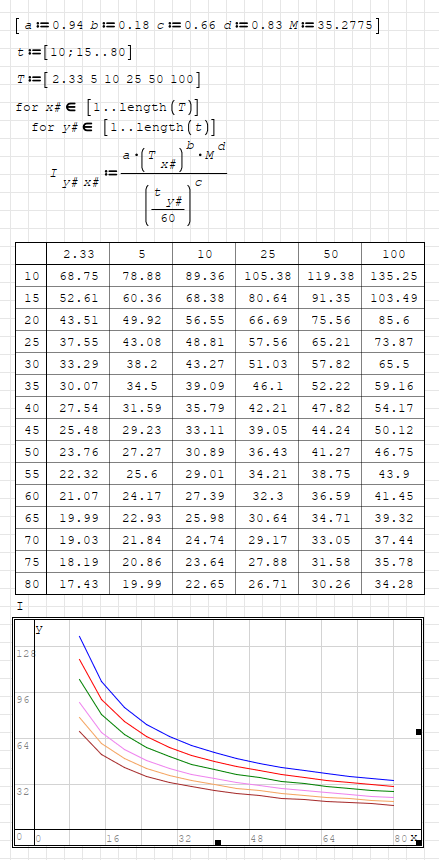
- Here is your table calculated with algorithm
- It is possible to plot multiple entities
Regards
matrix.sm (15,56 КиБ) скачан 989 раз(а).
WroteWroteHi, can someone help me with the solucion of this problem that i have, I need to create a matrix with the vector "t" in the first column and in the first row with the values of "T1, T2..T6", and the matrix has to be filled with the equation "I".
FINALLY I HAVE TO GRAPH IN THE X-AXIS THE VALUE OF "t" AND IN THE AXIS AND THE VALUES THAT I FIND OF "I" FOR EACH "T1, T2 ... T6". IS IT POSSIBLE THAT THE CURVES ARE IN THE SAME GRAPHIC? LIKE THIS
- Here is your table calculated with algorithm
- It is possible to plot multiple entities
Regards
matrix.sm (15,56 КиБ) скачан 989 раз(а).
THANKS FOR YOU HELP
WroteWroteHi, can someone help me with the solucion of this problem that i have, I need to create a matrix with the vector "t" in the first column and in the first row with the values of "T1, T2..T6", and the matrix has to be filled with the equation "I".
FINALLY I HAVE TO GRAPH IN THE X-AXIS THE VALUE OF "t" AND IN THE AXIS AND THE VALUES THAT I FIND OF "I" FOR EACH "T1, T2 ... T6". IS IT POSSIBLE THAT THE CURVES ARE IN THE SAME GRAPHIC? LIKE THIS
- Here is your table calculated with algorithm
- It is possible to plot multiple entities
Regards
matrix.sm (15,56 КиБ) скачан 989 раз(а).
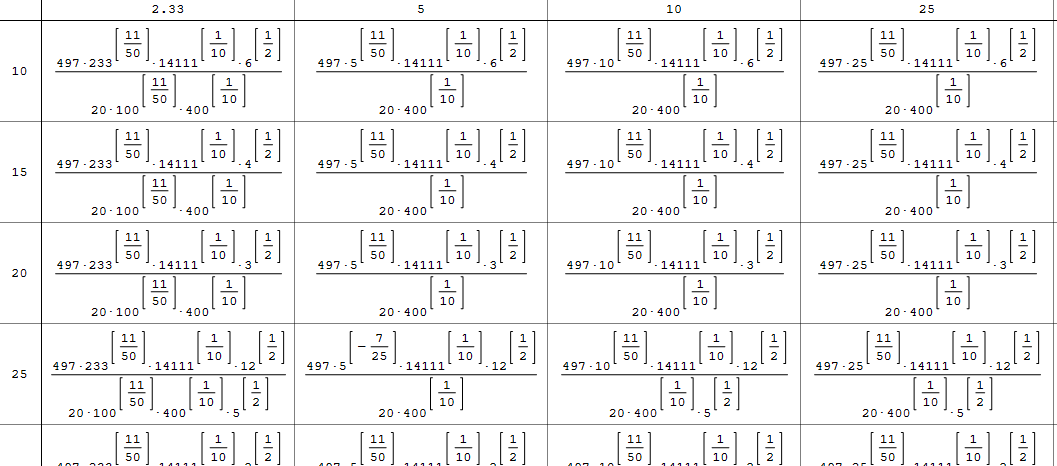
I AM TRYING TO DO IT, BUT WHEN I CREATE THE TABLE IT DOES NOT SHOW ME THE RESULTS ONLY THE EQUATION LIKE THIS,
CAN YOU TEACH ME HOW I DO IT PLEASE??, THANK YOU
WroteWroteWroteHi, can someone help me with the solucion of this problem that i have, I need to create a matrix with the vector "t" in the first column and in the first row with the values of "T1, T2..T6", and the matrix has to be filled with the equation "I".
FINALLY I HAVE TO GRAPH IN THE X-AXIS THE VALUE OF "t" AND IN THE AXIS AND THE VALUES THAT I FIND OF "I" FOR EACH "T1, T2 ... T6". IS IT POSSIBLE THAT THE CURVES ARE IN THE SAME GRAPHIC? LIKE THIS
- Here is your table calculated with algorithm
- It is possible to plot multiple entities
Regards
I AM TRYING TO DO IT, BUT WHEN I CREATE THE TABLE IT DOES NOT SHOW ME THE RESULTS ONLY THE EQUATION LIKE THIS,
CAN YOU TEACH ME HOW I DO IT PLEASE??, THANK YOU
I have done nothing special. It seems your table is shown as optimization-none.
I didn't know if there is an option for this, however your pc made it possible.
Update your smath and plugins to the latest version. Watch the video below.
If it doesn't work as it is shown, then this is a bug. File a bug report.
WroteWroteWroteWroteHi, can someone help me with the solucion of this problem that i have, I need to create a matrix with the vector "t" in the first column and in the first row with the values of "T1, T2..T6", and the matrix has to be filled with the equation "I".
FINALLY I HAVE TO GRAPH IN THE X-AXIS THE VALUE OF "t" AND IN THE AXIS AND THE VALUES THAT I FIND OF "I" FOR EACH "T1, T2 ... T6". IS IT POSSIBLE THAT THE CURVES ARE IN THE SAME GRAPHIC? LIKE THIS
- Here is your table calculated with algorithm
- It is possible to plot multiple entities
Regards
I AM TRYING TO DO IT, BUT WHEN I CREATE THE TABLE IT DOES NOT SHOW ME THE RESULTS ONLY THE EQUATION LIKE THIS,
CAN YOU TEACH ME HOW I DO IT PLEASE??, THANK YOU
I have done nothing special. It seems your table is shown as optimization-none.
I didn't know if there is an option for this, however your pc made it possible.
Update your smath and plugins to the latest version. Watch the video below.
If it doesn't work as it is shown, then this is a bug. File a bug report.
I found the error, thank you so much
- Новые сообщения
- Нет новых сообщений