1 страниц (3 вхождений)
about 3D plot - limit the XY axis - Сообщения
for the fist time to use smath, I have a question.
when I plot a 3D graph z=x*x+y*y, the Z axis means the function value
My question is if the Smath can limit the XY axis, for example the Z axis graph only shows the area that X>Y, not the whole plane。
from the another point of view , the function Z(x,y) can be limited by some condition that limit the value of XY?
Wrotefor the fist time to use smath, I have a question.
when I plot a 3D graph z=x*x+y*y, the Z axis means the function value
My question is if the Smath can limit the XY axis, for example the Z axis graph only shows the area that X>Y, not the whole plane。
from the another point of view , the function Z(x,y) can be limited by some condition that limit the value of XY?
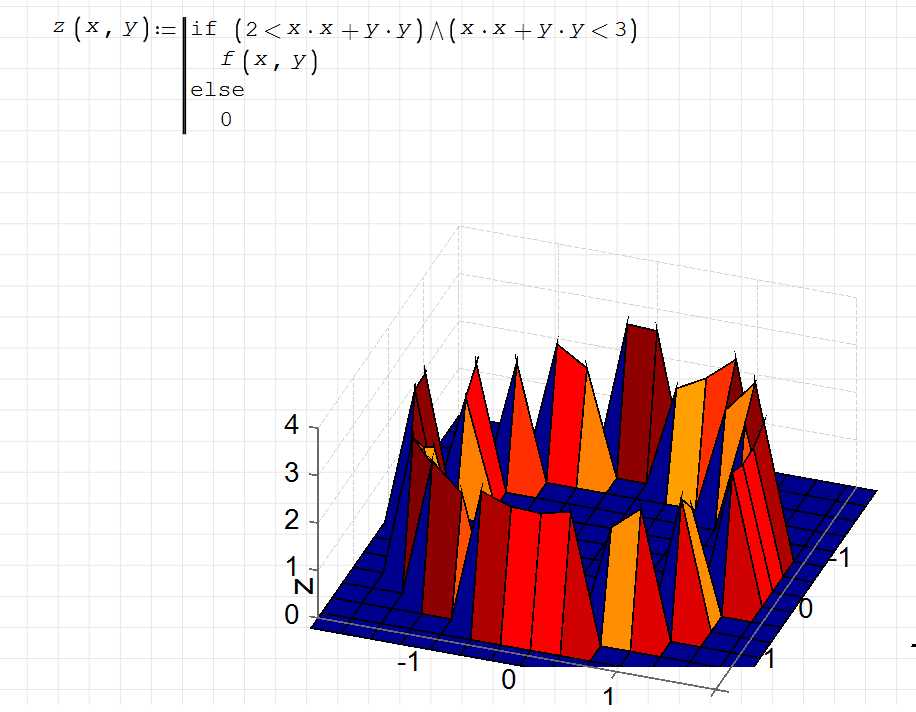
the mesh grid can be small?
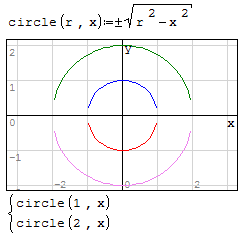
As shown in the attachment, what you want to display is a circle, but it's too rough。
can the mesh grid be smaller?
Wrotewhat you want to display is a circle
1 страниц (3 вхождений)
- Новые сообщения
- Нет новых сообщений