1 страниц (4 вхождений)
2D vector plot - plot vector values on Y axis against vector index on X axis - Сообщения
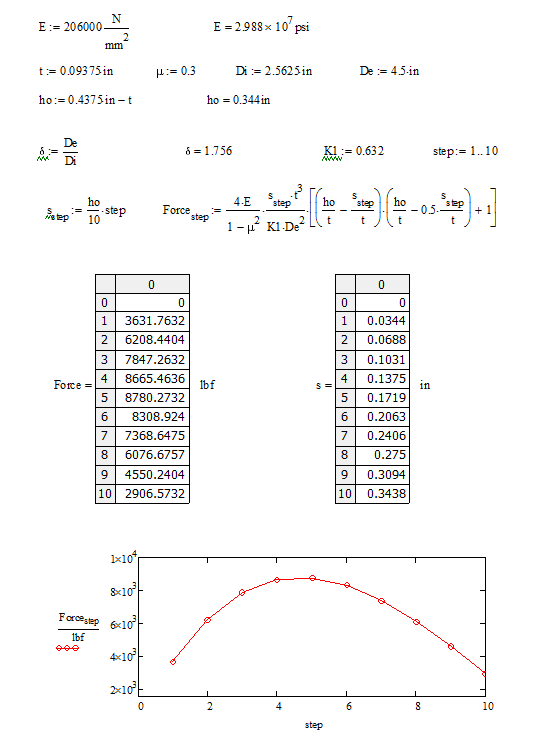
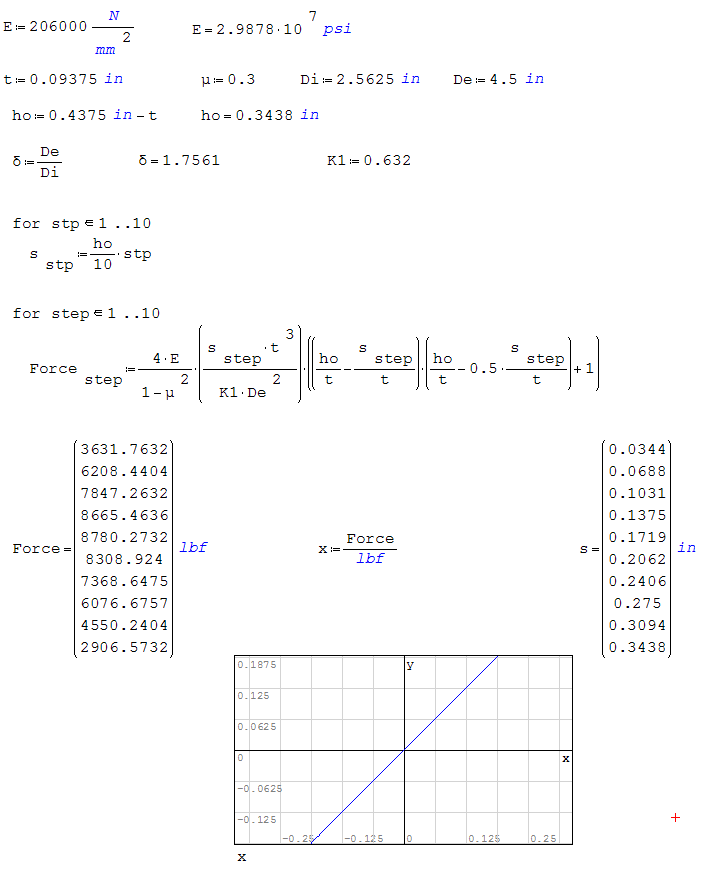
I try to plot a vector of results on a 2D graph to better visulize the results.
I would like to plot the vector values on the Y axis against the vector index on the X axis.
Here I post what I have done in MathCad and what I try in SMath.
issue 1: I need help in defining the plot value for SMath.
issue 2: I also need help in how to define two or more expressions within one for loop.
.png)
.png)
Thank you,
Jay
I would like to plot the vector values on the Y axis against the vector index on the X axis.
Here I post what I have done in MathCad and what I try in SMath.
issue 1: I need help in defining the plot value for SMath.
issue 2: I also need help in how to define two or more expressions within one for loop.
Thank you,
Jay
Just use x as index.WroteI would like to plot the vector values on the Y axis against the vector index on the X axis.
Use the line() function (programming palette) to set up blocks of expressions.
Technische Mechanik mit SMath Studio: https://link.springer.com/book/10.1007/978-3-658-50592-9
Thank you mkraska.
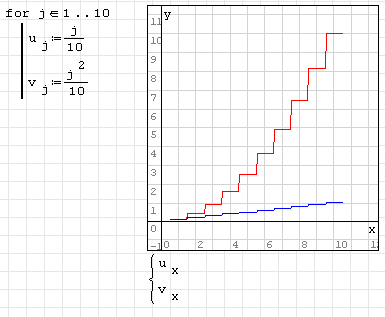
this is what I have now.
[albumimg]340[/albumimg]
By chance, is there any way to have the plot connect the data points with a line segment between points rather than having this stepped look? If so, it would easier to see the slope of the curve at the various divisions along the way.
this is what I have now.
[albumimg]340[/albumimg]
By chance, is there any way to have the plot connect the data points with a line segment between points rather than having this stepped look? If so, it would easier to see the slope of the curve at the various divisions along the way.
Wrote
By chance, is there any way to have the plot connect the data points with a line segment between points rather than having this stepped look? If so, it would easier to see the slope of the curve at the various divisions along the way.
Yes, of course. See the attached handbook pages.
Section 2D plots XY Plot Plugin.sm (58,09 КиБ) скачан 1227 раз(а).
Technische Mechanik mit SMath Studio: https://link.springer.com/book/10.1007/978-3-658-50592-9
1 страниц (4 вхождений)
- Новые сообщения
- Нет новых сообщений