1 страниц (12 вхождений)
Plot - Units, different axis names than x, y, ... - I cannot make any sensible and useful engineering plot working. - Сообщения
Hello,
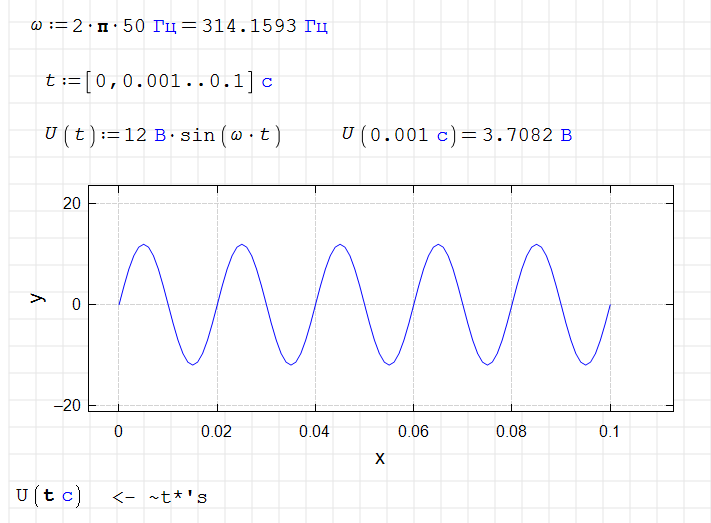
I am a satisfied SMath user and have recommended it to my engineering students. We have immediately stumbled over a huge problem. We are unable to show any meaningful graphs of real problems. With units, correct names or descriptions on axes, etc. I have tried everything, but once I don't see any errors, the graph still shows nothing. Then, there is an error, something like "Result is over max. positive number." I am just trying to display a sine wave voltage. Please, can somebody help me? I was googling extensively, but when there is a promising answer, it is very vague, just showing that it is possible without any help.
This is just my trials, but I have not been able to get any curves in the several graphs.
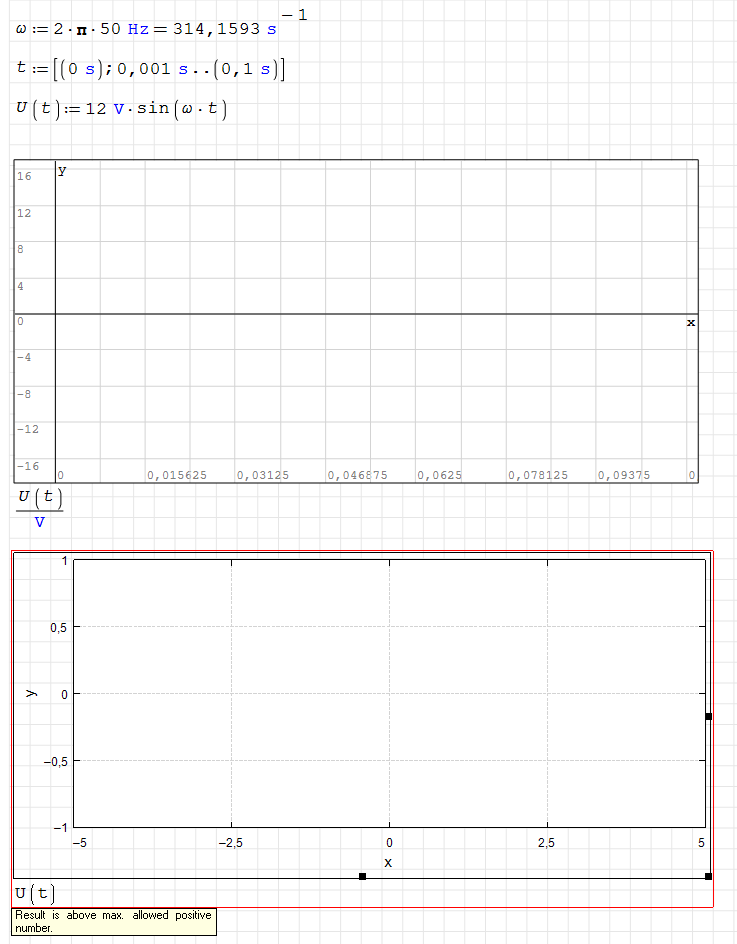
Edit: The image does not show. You can find it here: http://public.uli.cz/smath-plot.png
Thanks a lot
Olda
I am a satisfied SMath user and have recommended it to my engineering students. We have immediately stumbled over a huge problem. We are unable to show any meaningful graphs of real problems. With units, correct names or descriptions on axes, etc. I have tried everything, but once I don't see any errors, the graph still shows nothing. Then, there is an error, something like "Result is over max. positive number." I am just trying to display a sine wave voltage. Please, can somebody help me? I was googling extensively, but when there is a promising answer, it is very vague, just showing that it is possible without any help.
This is just my trials, but I have not been able to get any curves in the several graphs.
Edit: The image does not show. You can find it here: http://public.uli.cz/smath-plot.png
Thanks a lot
Olda
Отредактировано 16.03.2026 10:37:57
If you are working with vectors, you need to use vectorize().
If you are trying to plot, only Y axis values not enough.
You have to tell what are X values also.
Regards
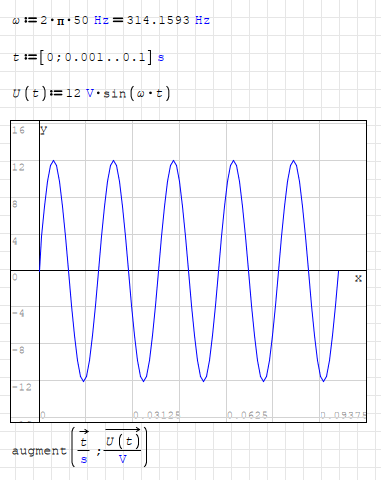
If you are trying to plot, only Y axis values not enough.
You have to tell what are X values also.
Regards
Отредактировано 16.03.2026 13:42:30
Thank you very much!
Now, is there a reasonably simple way to get t [s] and U [V] to the axes? Or at least some description. I really love SMath, and I didn't need the plots because I am mostly doing some mechanical engineering and machine design linear calculations. But as soon as I showed that software to my more electrical engineering-focused students, they came up with this question. I have been using Mathcad (v14 and 15) for a long time, and there is no problem doing this task very easily. I have been really surprised by how big a problem it is for SMath.
Thanks a lot again
Olda

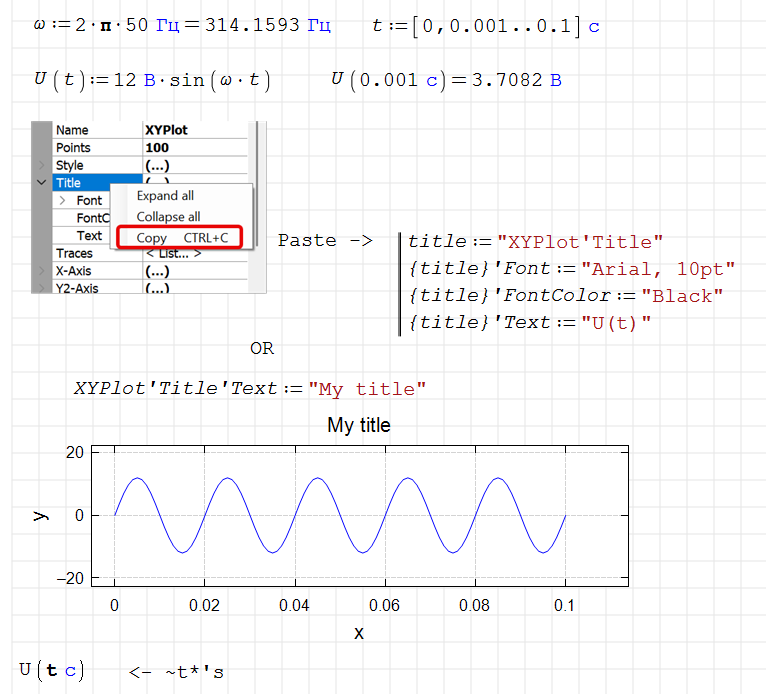
Historically, many components in a document have only one placeholder. This applies to plot components as well. Therefore, working with them is different. With only one placeholder, it's difficult to explain to the component what's expected of it.
This was originally done to simplify component creation. It was later retained for compatibility reasons.
Now, by default, the argument range is taken from the plot itself; it doesn't need to be specified explicitly.
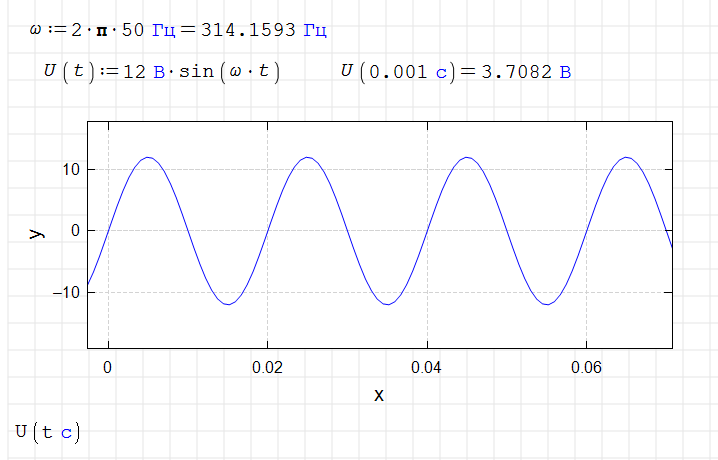
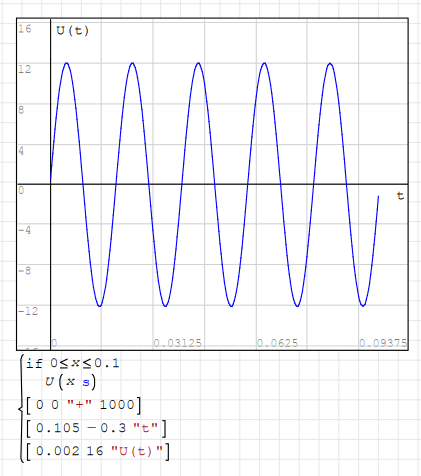
In the plot above, we say to use the x-axis value with a specific unit as an argument so that the calculation inside the component does not return an error.
Using a vector (range variable) is a special case for X-Y Plot.
This was originally done to simplify component creation. It was later retained for compatibility reasons.
Now, by default, the argument range is taken from the plot itself; it doesn't need to be specified explicitly.
In the plot above, we say to use the x-axis value with a specific unit as an argument so that the calculation inside the component does not return an error.
Using a vector (range variable) is a special case for X-Y Plot.
Отредактировано 17.03.2026 13:34:59
Russia ☭ forever, Viacheslav N. Mezentsev
WroteNow, is there a reasonably simple way to get t [s] and U [V] to the axes? Or at least some description.
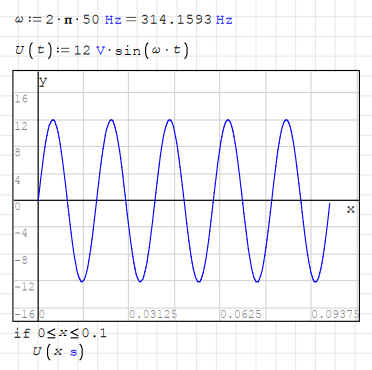
Mathcad will never be able to do this. This is one of the options.
Russia ☭ forever, Viacheslav N. Mezentsev
Actually there is a simple way.WroteNow, is there a reasonably simple way to get t [s] and U [V] to the axes?
But you have to know something beforehand.
Because you are so used to it, you think mathcad-way.
You need to start thinking smath-way.
Regards
Thanks very much to all of you. I think now I see that working with units is no problem. My question was more cosmetical, presentational. Can the x and y at the axes be replaced? You know, those are the questions of my students.
Best regards
Olda
Best regards
Olda
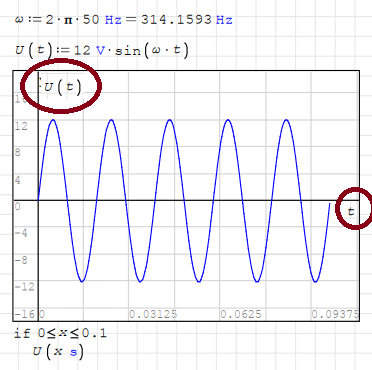
I don't know how to do this for a regular 2D Plot. You could try disabling the axes and drawing what you need yourself.
Russia ☭ forever, Viacheslav N. Mezentsev
WroteCan the x and y at the axes be replaced? You know, those are the questions of my students.
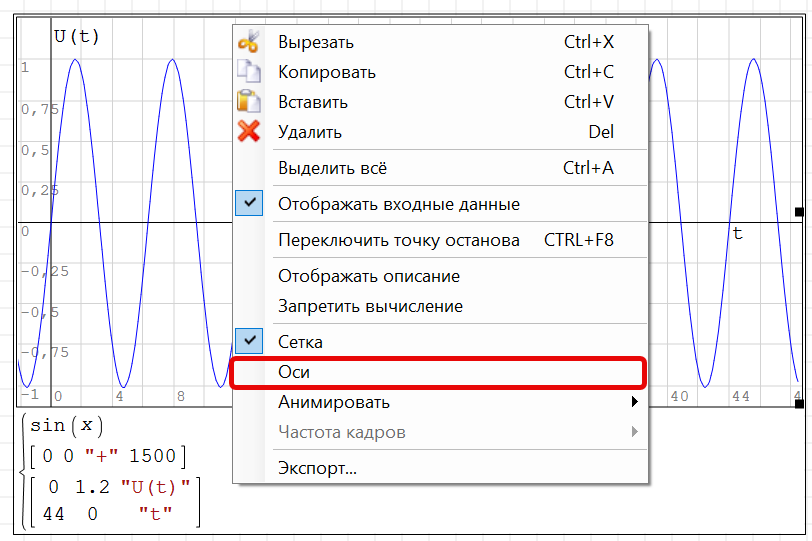
Not easily, but original axes can be disabled via right-click.
And new origin rays and labels can be inserted.
However, this is not a perfect replacement.
You will need to manipulate each different plot.
Regards
WroteWroteCan the x and y at the axes be replaced? You know, those are the questions of my students.
Not easily, but original axes can be disabled via right-click.
And new origin rays and labels can be inserted.
However, this is not a perfect replacement.
You will need to manipulate each different plot.
Regards
Ok. One more silly question. How do I get the long curly brace under the plot to put the definitions there? I am clicking right-left, double-clicking... nothing.
Thank you
Отредактировано 20.03.2026 12:40:35
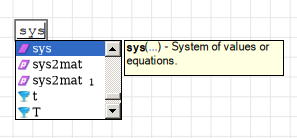
WroteHow do I get the long curly brace under the plot to put the definitions there?
It is the sys() function. Matrices and system of values similar but not same.
Regards
Отредактировано 20.03.2026 13:07:12
1 страниц (12 вхождений)
- Новые сообщения
- Нет новых сообщений