Graph settings - Сообщения
1. Can the graph region be locked for things like zoom and axis assignments and the like? If so, HOW?
I swear, every time I fix the format on a graph, if I don't cock me head to look at it right and chant the special secret incantation, it will protest and jumble itself. Really though, if I am not paying attention and put the mouse focus on the graph, mouse or arrow gestures will mess it up.
2. Can the axis limits be assigned to a variable or string?
For example, if I want the axis range to round up and down to the next 'hundred' of my dataset, I have tried to find the upper and lower bounds by-
100*Ceil(Y.max/100)
and
100*(Floor(Y.min/100)-1)
but it does not seem that graph format function likes those.
I created a snippet using Uni's setprop function for XYPlot. You may find it useful.
WroteTake a look at my post HERE.
I created a snippet using Uni's setprop function for XYPlot. You may find it useful.
That was the ticket!
I used an include statement to point to the "F:\references\SMATH\XYPlotProps.sm" file and then set the properties by the example.
I was able to auto-set my graph limits by a bit of functions, and if I mess up the graph, I can recalc (F9) and it will reset itself.
https://i.imgur.com/nbYH2lr.png

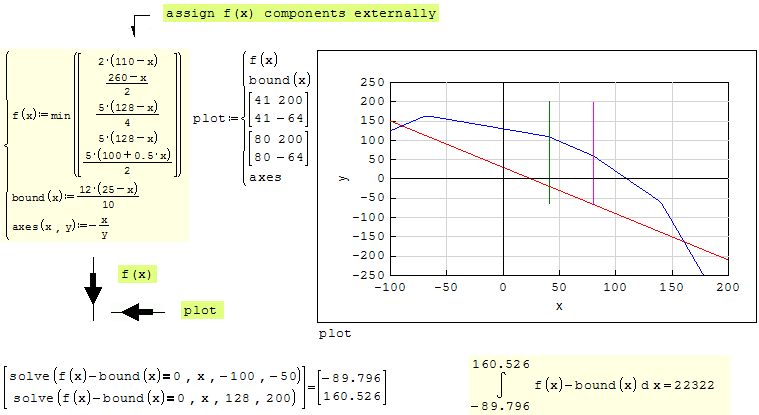
2D Plot Discontinuous [min(,)].sm (27,31 КиБ) скачан 809 раз(а).
Wrote... Dichotomy added for solving in the complex region.
filling the loft added.
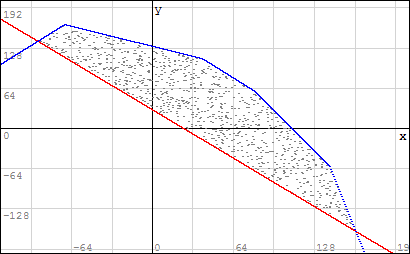
2D Plot Discontinuous [min(,)].sm (44,7 КиБ) скачан 822 раз(а).
but how do you set your graph axis to -100
that is what i was trying to fix to hard values so it would not move or rescale the graph
sinneD
Wrotebut how do you set your graph axis
1. Dispose the plot from plotting using Smath @ QuickPlot
zoom, shift left/right, up/down ...
2. Plot on the X_Y, set the X ± limits, Y ± limits.
3. plot ... 4. specify the traces from "list"
As simple as explained, no sweat ! ... Last plot.
2D Plot Discontinuous [min(,)].sm (44,49 КиБ) скачан 844 раз(а).
I think that you are missing the point of my query- to be able to control and constrain the region of the plot.
Perhaps you should have a peek at what alyles has done. It seems to be extensible to other graphs and charts.
https://en.smath.com/forum/yaf_postsm59248_X-Y-Plot-Region.aspx#post59270
WroteI think that you are missing the point of my query- to be able to control and constrain the region of the plot.
Perhaps you should have a peek at what alyles has done. It seems to be extensible to other graphs and charts.
I only work w/o problems with strictly native Smath per say SS 6179.
The procedure offered should work for your latest SS, try it.
X_Y plot has its own [X, Y directions] min/max.
QuickPlot @ has to be often explored for where it locates.
From there, switch to X_Y plot
If you refuse the X_Y plot, you may be missing essentials features,
particularly for quality publishing.
WroteI think that you are missing the point of my query- to be able to control and constrain the region of the plot.
You don't have a document, then no query ... is it ?
Easy to constrain the @ quick plot from "if/otherwise"
I think that you are missing out on a great number of improvements to SMath if you are still using version 6xxx...
Here are 2 screen grabs-
1. The right click-format method. It works, but it is VARY tedious, and if you happen to click in the graph and move or scroll, the whole thing gets thrown off.
2. Using the XYPlotProps that alyles suggested allows the user to define the format to things like the axis limits and tics and the grid and the like.
The added benefit to this method is that if you happen to mess up the formatting of the graph, you can simply recalculate and it will reset the graph to the limits defined.


WroteI think that you are missing out on a great number of improvements to SMath if you are still using version 6179...
Interesting, but not so much.
By the rules of QA [Quality Control, certification],
a document must be stand alone, i.e: Include is rejected.
I appreciate the effort, but only gadget plot.
My last post Mathsoft Collaboratory was read > 2000 times
in < 24 hr. At all Collabs > 125000 post Akiva must have
collected zillions posts ... how many used "Reference"
[equivalent to Smath Include] ... NONE, only very few
to illustrate using it.
The attached document computes two Orifice Plate examples,
done otherwise 1987 for Magnesium Refinery.
It will pass QA from referenced:
1. Spink [the Bible].
2. AGA [US Bible}
3. ISO-5167 [the Bible of all Bibles].
For sure I know about "Include", posted in this Forum.
Otherwise, you won't see my attachment "Include".
Only stand alone documents.
Inst_Orifice Plate.sm (387,23 КиБ) скачан 1074 раз(а).
Too many updates SS, too many problems at each update.
Thus by far not yet a limited replacement to Mathcad/Mathsoft,
for whatever it can do as well. Further, at each SS last build,
reported problems come by pure coincidence.
It would take > one week running over my > 2000 documents.
WroteThe added benefit to this method is that if you happen to mess up the formatting of the graph, you can simply recalculate and it will reset the graph to the limits defined.
Once X_Y is all set for the project, it will update for new
entries of the project. That's what I want exactly.
So, easy to observe the new project evolution wrt original.
In the attached, change n[50] for n[40]
X_Y updates silently. You may want to update other parameters.
In all that, the truth is that each user has to exhaust the
stuff he is using, here particularly the X_Y in cause.
From observation, SS version(s) to version(s)is more around
gadgets rather than CAS real stuff. The great switch was from
SS 5346 => ss 6179.
Next SS 6179 build:
1. make sure all function are scalar [reported: X^Y, erf, Gamma ...]
2. an evaporate function to replace Clear(,)
3. 15 D Gamma(x)
4. add the advanced integrators
5. clean arithmetic palette from numerals, arithmetic operations.
... few more to enhance SS at CAS level.
2D Isometric.sm (92,61 КиБ) скачан 1052 раз(а).
- Новые сообщения
- Нет новых сообщений