1 страниц (3 вхождений)
Variable plotting - Сообщения
Hello to everybody,
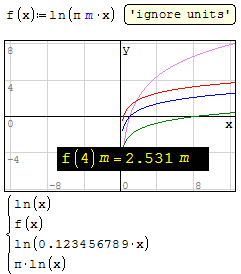
I am trying to represent a graph where arguments include units. I have seen that it is necessary to divide these variables by their units to do it. I want to know about the possibility to not to do this, because I want to change the input units and it is a quite complicated to be dividing the units in the next lines.
Thank you.
JJJ
Not sure what you want w/o Smath document.

Greetings,
Dividing units out may be the best option, otherwise the units on your graph will default to base units (that is, if you get units to work as expected). But, just be aware that there are plugins that may produce the graph you are interested in; You can explore the other posts on this forum for some insight:
You can check out these forums:
- https://en.smath.com/forum/yaf_postst21520_X-Y-Plot-for-electrical-resistance.aspx
- https://en.smath.com/forum/yaf_postst20103_Plotting-with-2D-plot.aspx
- https://en.smath.com/forum/yaf_postst4455_Interaction-Diagram-for-Rectangular-Reinforced-Concrete-Sections--ACI-318.aspx
May this be of Good Help,
SK Kenny Lemens, P.E. ᵂᴵ
"No matter where you go, there you are." -Buckaroo BanzaiHotkeys: https://en.smath.com/forum/resource.ashx?a=45771&b=2
1 страниц (3 вхождений)
- Новые сообщения
- Нет новых сообщений