weird 3d graph behaviour - Сообщения
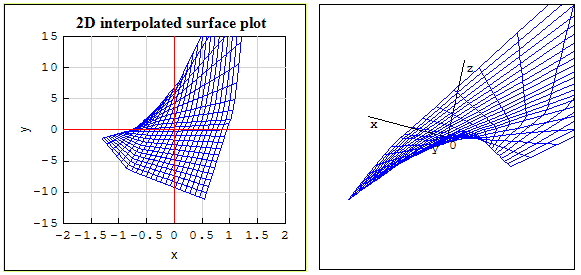
results in a weird 3d graph, unless manually refreshed.
I also have to press refresh every time I change anything on the sheet because it goes back to being weird.

3d.sm (6,19 КиБ) скачан 1314 раз(а).
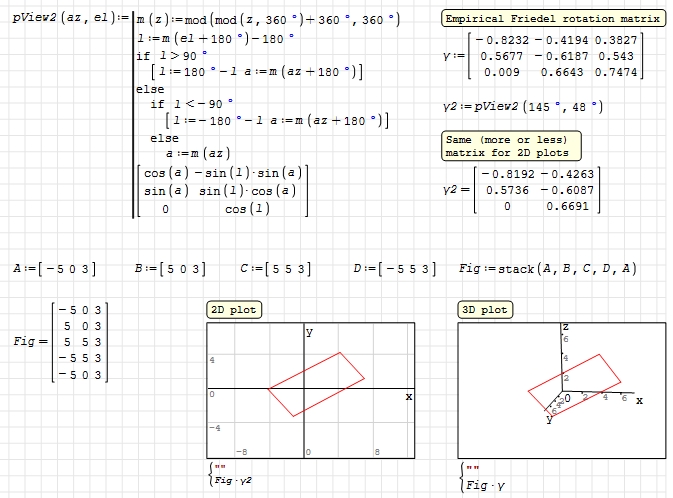
WroteTo prevent the 3D graph from changing its perspective, we multiply its matrix by the empirical gamma coefficient.
3d.sm (6,19 КиБ) скачан 1314 раз(а).
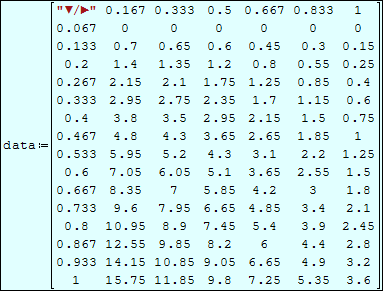
what does that even mean? I figured out that the matrix should contain coordinates of the points in its rows, but what's the "empirical gamma coefficient"?
WroteTo prevent the 3D graph from changing its perspective,
we multiply its matrix by the empirical gamma coefficient
... while remembering Fig*γ is not commutative.
Jean
Wroteit's buggy though, one would expect graph to not change it's view whenever anything changes, and numbers are disappearing from the axes too, which is super odd.
Fridel gave you the minimalist guidance/model 3 cols + rotation.
The 3D plot has a fixed native orientation,
then rotate manually to better view, then capture as fixed image.
Wrotevisit more ...
Rotate 3D TREASURY_5 Quaternions MODULO Explorer.sm (71,8 КиБ) скачан 1358 раз(а).
what am I supposed to look for it there?
WroteWrote
what does that even mean? I figured out that the matrix should contain coordinates of the points in its rows, but what's the "empirical gamma coefficient"?
3d.sm (13,76 КиБ) скачан 1310 раз(а).
Alvaro.
isn't it a workaround for a problem with smath itself?
Wrotewhat am I supposed to look for it there ?
1. open 3D, assign plot argument
2. show/hide axes/grid
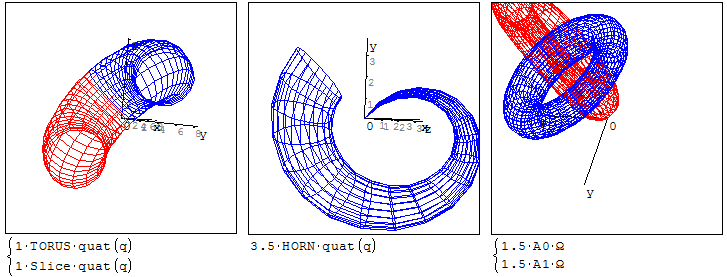
3. 3.5*HORN*quat(q)...3.5 zoom at will
4. quat(q) the Quaternion rotation system
5. 'q' 1/24 pre-rotation [Quaternion]
5. mesh CreateMesh either/both directions
6. rotate the 3D manually
Wrotewhat am I supposed to look for it there ?
... look for more.
Rotate Sphere ANIM.sm (25,04 КиБ) скачан 1281 раз(а).
BTW, Mathcad 11 is exceptional rendering Breather.
Collapsed area is immense [96 pages long].
Wait all frames done ... now continuous rotation.
Hope you have subsequently enjoyed your very first visit.
Rotate Breather ANIM.sm (995,52 КиБ) скачан 1346 раз(а).
Graph given by a function, or given by a matrix.If you can
attach your worksheet. I think someone will help you.
WroteHello an-10.Reportage what 3D graph you want to create.
Graph given by a function, or given by a matrix.If you can
attach your worksheet. I think someone will help you.
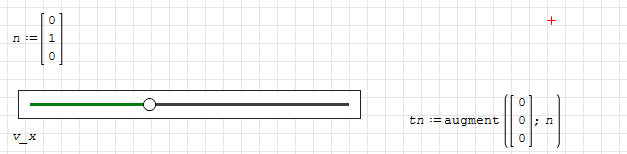
I am not "trying" to create a graph, I know I can plot vectors using matrices by putting points in the rows of a matrix.
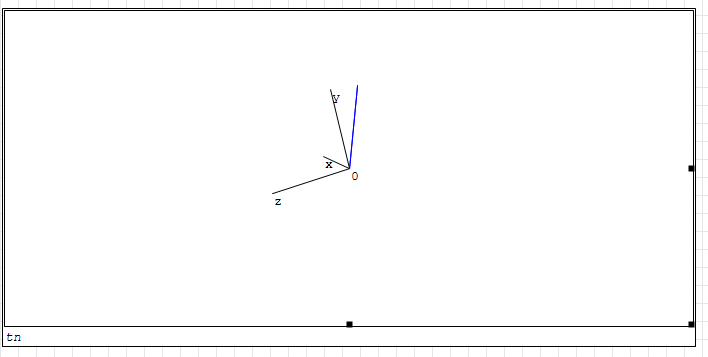
I am reporting a buggy behaviour of a 3D graph, whenever contents of the sheet changes, graph's view resets and plot inside of it becomes garbled, until I press refresh, but even then, when I refresh, view resets which is a completely undesireable thing. Not to mention that the axes of the graph are not extending beyond some view-fixed threshold which is annoying (and numbers also disappear from the axes when I make modifications to the sheet). I hope you will finally understand that this isn't an issue with me not understanding how to do X or Y, but a bug report.
WroteWroteWrote
what does that even mean? I figured out that the matrix should contain coordinates of the points in its rows, but what's the "empirical gamma coefficient"?
...
Alvaro.
isn't it a workaround for a problem with smath itself?
Nope. That was my failed attempt to answer your very specific question about what gamma was, but you seem to have lost interest in it given that you comment my answer with another unrelated question as well.
Wrote...
I am reporting a buggy behaviour of a 3D graph
Well, I would not agree to say that it is a buggy behavior, but simply that component restores the default view when recalculating, which does not seem erratic behavior, except that you fix it by means of a rotation matrix, which, like we know, you don't seem to be interested anymore.
The point is that there is not a single "3D graph", there are several: 3D plot component, Maxima 3D plots, Maple 3D plots, dislin 3D plots, Microsoft 3D Charts, SVG graphics, to name the ones I remember, but there must be more. Each has its advantages and disadvantages. So, what you found boggy in one, maybe others could see that as useful.
But since you are not "trying" for create a graph, I assume that you are not interested in the other ways to create one.
Wrote...
I hope you will finally understand that this isn't an issue with me not understanding how to do X or Y, but a bug report.
Oh. It's good that you clarify it, I would have thought that was the problem, but now that you mention it, it is clear to me that it was not.
Alvaro.
WroteI am not "trying" to create a graph, I know I can plot vectors using matrices by putting points in the rows of a matrix.
I am reporting a buggy behaviour of a 3D graph, whenever contents of the sheet changes, graph's view resets and plot inside of it becomes garbled, until I press refresh, but even then, when I refresh, view resets which is a completely undesireable thing. Not to mention that the axes of the graph are not extending beyond some view-fixed threshold which is annoying (and numbers also disappear from the axes when I make modifications to the sheet). I hope you will finally understand that this isn't an issue with me not understanding how to do X or Y, but a bug report.
You were talking about 3D plot ... what are you trying to plot ?
Simple: here is the matrix, then the 3D project.
WroteI would not agree to say that it is a buggy behavior
"whenever contents of the sheet changes, graph's view resets and plot inside of it becomes garbled, until I press refresh, but even then, when I refresh, view resets which is a completely undesireable thing"
again
"graph's view resets and plot inside of it becomes garbled"
yet again
"becomes garbled"
honestly, I'm tired trying to convey this
WroteThe point is that there is not a single "3D graph", there are several
it seems that I'm using a built-in one, which isn't named like any from what you mentioned
Wroteyet again "becomes garbled"
honestly, I'm tired trying to convey this
The document I attached, is it garble ?
- Новые сообщения
- Нет новых сообщений