[2d Plot] Axis limits - Plots do not fit axes to data, so data are not visible. - Сообщения
WroteX_Y plot => you set the x, y limits
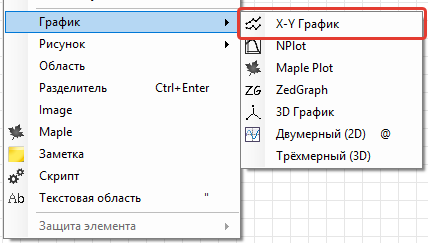
the QuickPlot => you wheel/mouse/zoom the x, y
Shift wheel mouse for the x
Ctrl wheel mouse for the y
click in plot shift up/dn, left/right to move the plot.
WroteThe @ plot is the quick plot. You are correct, it does not autoscale. The X-Y plot that Jean mentioned is a plugin for the PC based software.
I agree, an auto zoom to the correct plot area would be nice
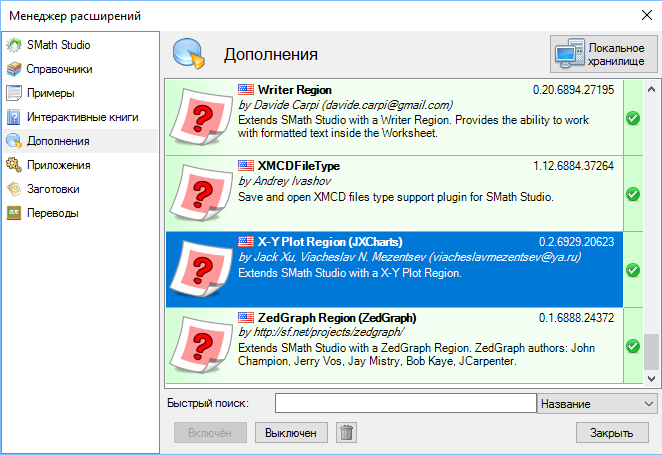
Where is the X_Y plot (axis limits) plugin available for download? Or, if it's already installed, how do you implement it?
I am using windows SMath version 0.99 build 6884.
Thanks!

Thanks for the reply!
WroteOK. I was being stupid...my extension manager was only showing the extensions "local storage". I had to switch it to "online gallery".
About X_Y plot: so interesting/useful, so bloody freak in other situations.
If the function includes ln(x) and if it starts from very low,
can't start at 0. Start at very low just crashed Smath [yesterday !]
yesterday I discovered SMath and I was impressed. I'm Mathcad 15 user, so I like similar behaviour.
But when I started playing with plot I realized that there is no automatic axis setting which is really pain.
I usually use the sheet as "live", so I change some value, do recalculate and instantly see the result in plot. This use is limited here only to small changes which fit in the current plot zoom. If values change more, you can not see them in the plot.
Anyway, thank you for this great tool!
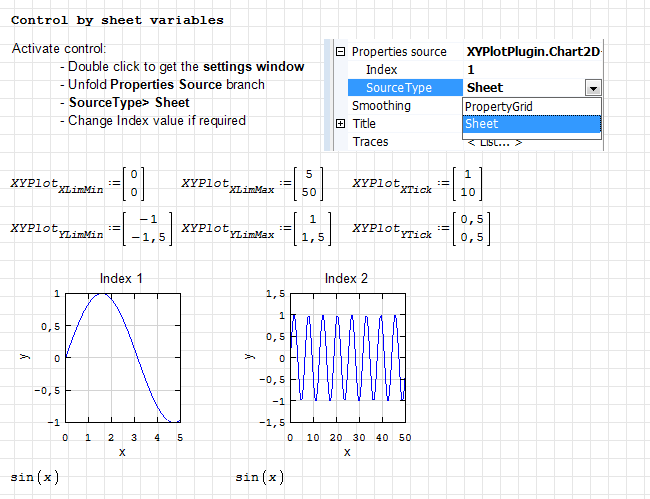
This plugin offers the possibility to control axis limits (and other stuff) using values or variables coming from previous calculation.
I have moved almost every office calculation tool from plotting with Smath native to "XY Plot" mainly for this feature.
You will find this explained in the XY plugin forum section, or more conveniently in remarkable "interactive handbook" prepared by user MKraska.
Just open the handbook and navigate to Graphics->2D Plot (XY plugin)
you will appreciate how superior Smath is vs MCD.
MCD native mesh is ½ pica, Smath is pixel. Thus allows
sizing graphs exactly same width of fine trace vs rough MCD.
1. Size the X_Y plot on your min/max 'x'
2. size Y axis on those min/max ... done.
On rough data points X_Y has spline junction [Isometric example].
For Implicit Trifolium: wait until all frames are calculated,
then see the wind mill rotate ... quick/lovely vs MCD
Solve Implicit Trifolium.sm (29,09 КиБ) скачан 1438 раз(а).
X_Y Plot Junior.sm (43,36 КиБ) скачан 1451 раз(а).
2D Isometric.sm (92,61 КиБ) скачан 1417 раз(а).
Utilities Discrete Algo Range INTERVALS Parts 1234.sm (84,91 КиБ) скачан 1439 раз(а).
WroteI'm now stuck on another thing... I wanted to try to emulate runif and rnorm from MC. And I'm having problems even with runif. See attached.
Your attempted code is illegal, simply.
rnorm is another story ... will be back.
runif (1).sm (4,94 КиБ) скачан 1454 раз(а).

WroteThank you both, I need to try it.
I'm now stuck on another thing... I wanted to try to emulate runif and rnorm from MC. And I'm having problems even with runif. See attached.
Thanks,
Mira
runif.sm (1,98 КиБ) скачан 1386 раз(а).
Simply use line() command after function definition as seen on attached image:
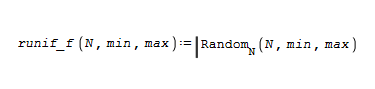
Regards!!
Random_1 Normal.sm (24,34 КиБ) скачан 1383 раз(а).
Random_9 Fill Range PDF.sm (31,23 КиБ) скачан 1406 раз(а).
Random_6 Weibull.sm (37,44 КиБ) скачан 1432 раз(а).
Random_3 Logistic.sm (48,99 КиБ) скачан 1439 раз(а).
Attached is something which seems to work, also rnorm included.runif.sm (16,17 КиБ) скачан 1403 раз(а).
I used histogram implementation found on this forum. It is little bit slow, but otherwise works nicely.
WroteThanks for the "line" hint! Is there any explanation why it is needed?
Is one of very many cases that needs the code be isolated,
particularly this one as it not scalar.
The attached Histogram should work.
Stat Histogram Create Normal Random.sm (70,3 КиБ) скачан 1410 раз(а)....SS6179
Higgs.sm (8,25 КиБ) скачан 1447 раз(а).
Pattern Brownian.sm (19,74 КиБ) скачан 1400 раз(а).
Pattern Brownian Collect Image.sm (24,79 КиБ) скачан 1388 раз(а).
WroteI used histogram implementation found on this forum. It is little bit slow, but otherwise works nicely.
Original version does not work SS 6179.
I made simpler otherwise and accelerated timing by ~ 20.
Will be posted soon included in bigger document "Histogram".
Jean
- Новые сообщения
- Нет новых сообщений