1 страниц (4 вхождений)
h(p1, p2) implicit plot - Why I can not create it? - Сообщения

Wrote
2RegP-Ideal-Cool_Prop.sm (82,18 КиБ) скачан 1322 раз(а).scratch geometry dash
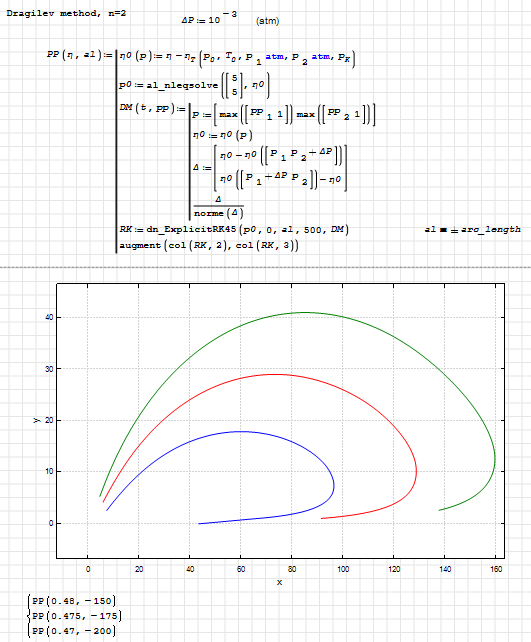
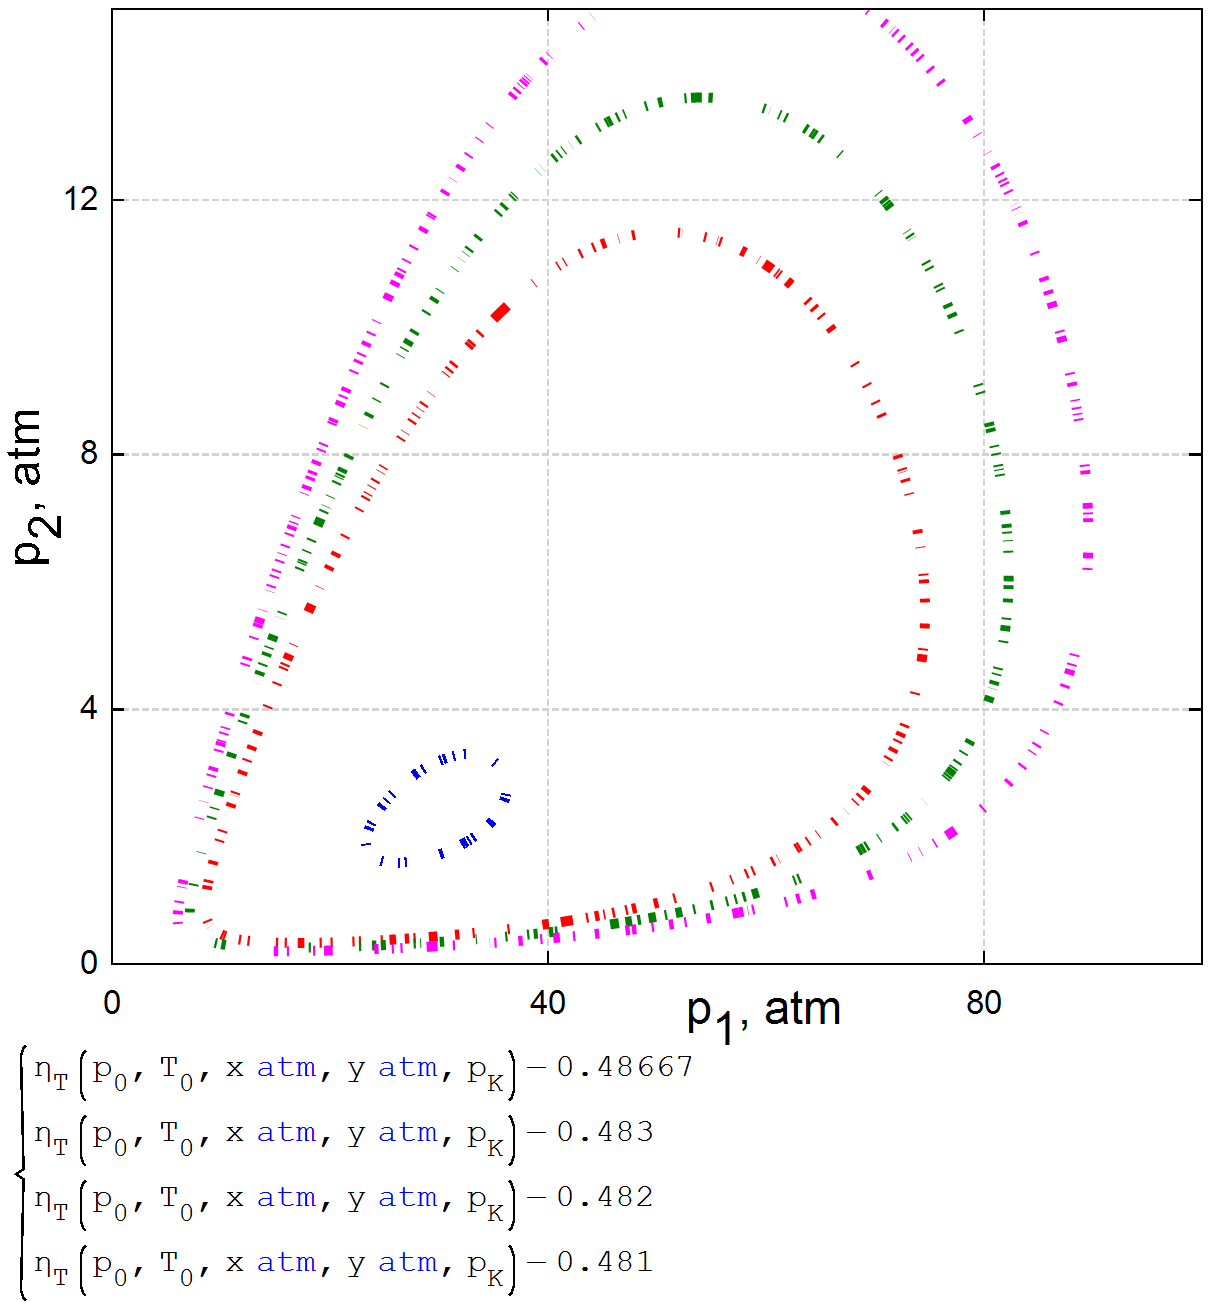
The graph you've provided seems to show a relationship between two pressures 𝑝1and 𝑝2, with annotations related to efficiency calculations.
Axes:𝑝1 on the x-axis (measured in atm). 𝑝2 on the y-axis (measured in atm).
Curves: Different colored curves (red, blue, and green) that might represent different states or processes in a thermodynamic cycle or system, such as isobars, isotherms, or other state transitions.
Water/Steam Cycle: Given the mention of "WaterSteame Pro," this graph might be related to a water/steam cycle analysis, such as a Rankine cycle or steam turbine efficiency calculation.
Efficiency (𝜂): The efficiency calculations likely relate to the performance of a particular component or the overall system under different pressures and temperatures.
The mention of "points > 20 - problems" suggests there might be issues with the data points or calculations when exceeding a certain number of data points.
1 пользователям понравился этот пост
Valery Ochkov 22.07.2024 17:02:00
Hi. You can use the Draghilev's method for parametrize a curve.
2RegP-Ideal-Cool_Prop (1).sm (82,56 КиБ) скачан 1255 раз(а).
2RegP-Ideal-Cool_Prop (1).pdf (317,07 КиБ) скачан 727 раз(а).
Best regards.
Alvaro.
2RegP-Ideal-Cool_Prop (1).sm (82,56 КиБ) скачан 1255 раз(а).
2RegP-Ideal-Cool_Prop (1).pdf (317,07 КиБ) скачан 727 раз(а).
Best regards.
Alvaro.
2 пользователям понравился этот пост
My solution
1 страниц (4 вхождений)
- Новые сообщения
- Нет новых сообщений