1 страниц (7 вхождений)
Line Plot from Set of x,y Data? - Сообщения
I'm sure that this must be easy, but I can't seem to do it.
I have a set of (x,y) data points (measurements, not generated by a function). How do I plot these as a line plot?
TIA
I have a set of (x,y) data points (measurements, not generated by a function). How do I plot these as a line plot?
TIA
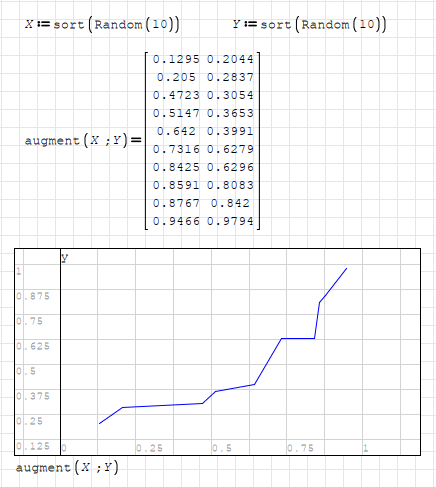
You can use augment() function.
WroteI have a set of (x,y) data points (measurements, not generated by a function).How do I plot these as a line plot ?
Augment experimental data [X,Y], simply plot.
Next, you may want to fit a model function.
If not too long attach an image ... NOT more than 4 decimals.
Jean
WroteNext, you may want to fit a model function.
So far he doesn't want.
When he asks for fitting then give those sample.
Thanks Overlord,
I couldn't find anything to tell me that!
I've used MathCad for decades, and have that system in my head: finding my way around SMath is a bit different. The documentation for beginners seems a bit sparse, to say the least,
Next request: is there a way of showing the data points joined by lines on the plot?
Again, TIA
WroteI've used MathCad for decades, and have that system in my head: finding my way around SMath is a bit different.
SMath is similar to Mathcad but not the same.
If you give SMath a try you will get used to it.
I find documentation is quite detailed actually.
Not a problem if you don't, feel free to ask anything.
This is a very friendly forum, you will get a working answer.
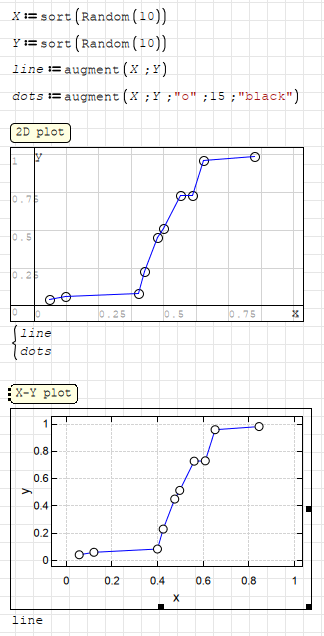
WroteNext request: is there a way of showing the data points joined by lines on the plot?
You can either use a new plot for dots or feature of X-Y plot plugin.
Double click to X-Y plot, there is option for dots under;
Traces > Appearance > SymbolStyle > Type.
I generally prefer using 2D plot for its simplicity whenever I can.
Sometimes X-Y plot plugin is required nonetheless, especially on x + y functions.
X-Y plot can do anything 2D plot does, except the animations.
And X-Y plot plugin has many detailed customizable options.
You have much control over Axis, Title, Labels, etc.
Here is a sample for your request.
Regards
dot_sample.sm (5,95 КиБ) скачан 1244 раз(а).
WroteI couldn't find anything to tell me that!
Jean is what he is, troll of this forum.
He has knowledge no doubt, but no intention to help people.
You will only see him promoting himself and his samples.
His replies won't be related with your requests.
And he has seriously flawed engineering sheets.
Worse of it, he will insist on his mistakes.
Don't take anything he writes as true, correct or relevant.
Thanks again Overlord
I think I've got it now.
As to your comments on Jean, I seem to remember him from the MathCad forum about 15 years ago, the last time I used MathCad professionally and used the forum. Most people there were helpful, but Jean often answered the question he thought should have been asked, not the one actually asked. I also remember that model fitting featured strongly, even (especially?) when it wasn't relevant. He had a buddy (a Russian?) and they reinforced each other's views and wound each other up. I learnt then to treat his ideas with caution.
Thanks again for your help.
Bests
1 страниц (7 вхождений)
- Новые сообщения
- Нет новых сообщений