Plot of functions having big range on Y axis - No plot when trying to plot functions having big range - Сообщения
and I'm not able to obtain a plot of the function nor even dividing the function by
1E+10 - I suspect a pb dealing big numbers - by the way I have also an error trying to use MAXIMA GNU.
Has anyone some idea/workaround?
Many Thanks

Please provide more information: source code, data, or a link with a function description.
Best,
Oscar
thanks for your quick reply.
Here attached the file so that you can see "hands-on" the issue.
For TMMT.sm (99,5 КиБ) скачан 1457 раз(а).
I still suspect a limitation in plot function dealing with "big" numbers....but even dividing by 1E+08 (and even more...)
seems to work in this case (I made some other tests and, sometimes, this trick is useful).
As you understand I need a "visualization" of the function in order to "guide" the "solve" function (that seems
to work remarkably well w.r.t. MathCAD, by the way....but I cannot always be so lucky in this kind of problems...).
P.S. for mkraska
1) the name of detZ is, maybe misleading....in facts detZ calculate the determinant of a reduced matrix...and in any case
the function detZ(x) is defined directly by 4 functions
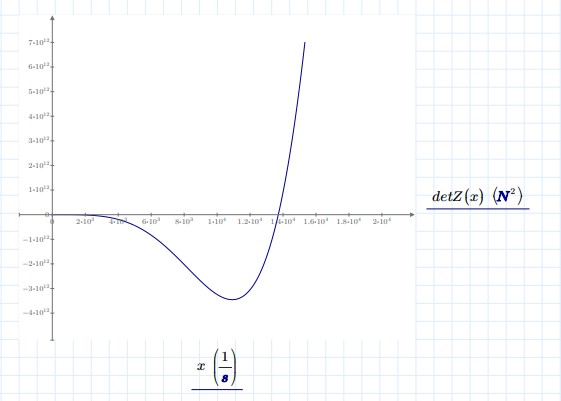
2) As you can see I can easily calculate the values of detZ(x) and find roots....BUT no plotting at all. By the way, due to complexity
of the function detZ(x), this last cannot be written explicitely....
3) I have difficulties to use Maxima for plotting (an error indicates that maxima.bat is apparently lacking in my -free- installation)...and, on the other side, I'm not allowed to install a new version of SMath without IT-manager support (he's actually in holydays...)....so, for the moment at least, no Maxima...
Last but not least: I'm a beginner (I discovered SMath 6 months ago and then I used it intensively, it's true) hence is possible that the way I have tackled the whole pb is not the most efficient (hence my issue with plotting...); so any suggestion, even completely changing the SMath sheet structure is welcome.
Thanks
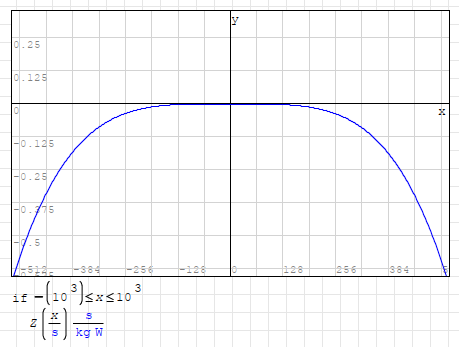
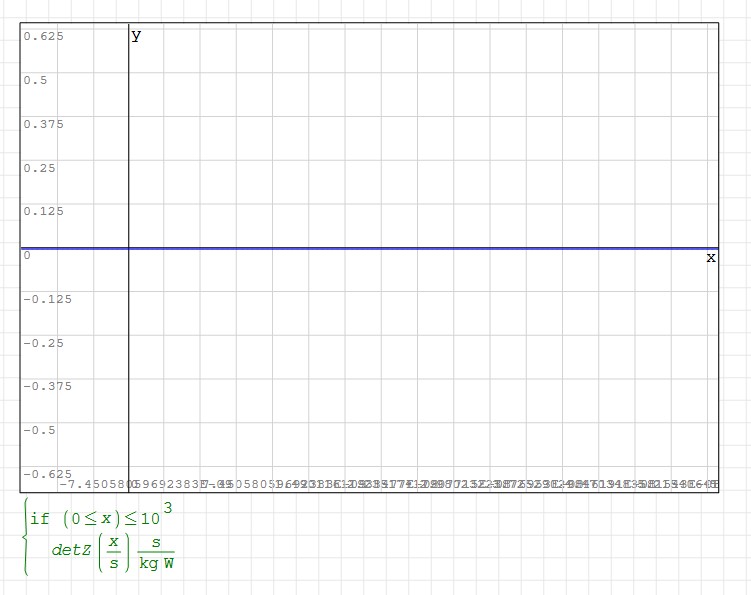
But plotting doesn't like units.
Get rid of them if you are plotting.
Regards
TMMT.sm (99,44 КиБ) скачан 1388 раз(а).
Best regards.
Alvaro.
many thanks once more, as I have both solved the problem and, most of all (for a beginner like me), learnt something more...
In any case, it seems to me that each SMath installation has its own combination of "tricks" working (or not working...).
For Overlord, don't bother with my further question on range definition, I have found in the meanwhile....but still not working (see below)
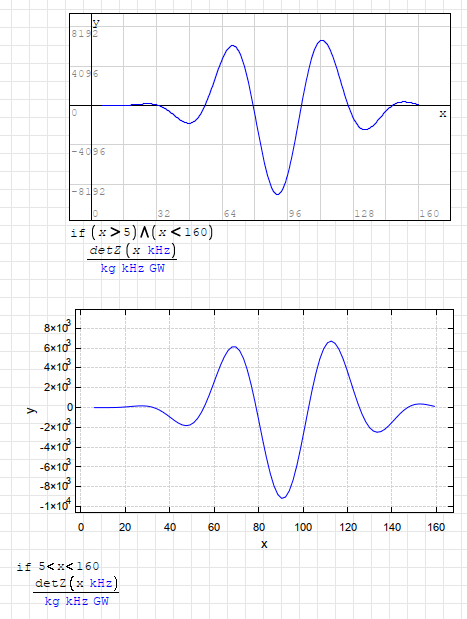
But once I combine the use of Plot native SMath function with unit scaling and range definition (as suggested and worked out by Razonar) and range definition...it works both with SMath native plot and with XY plot!!
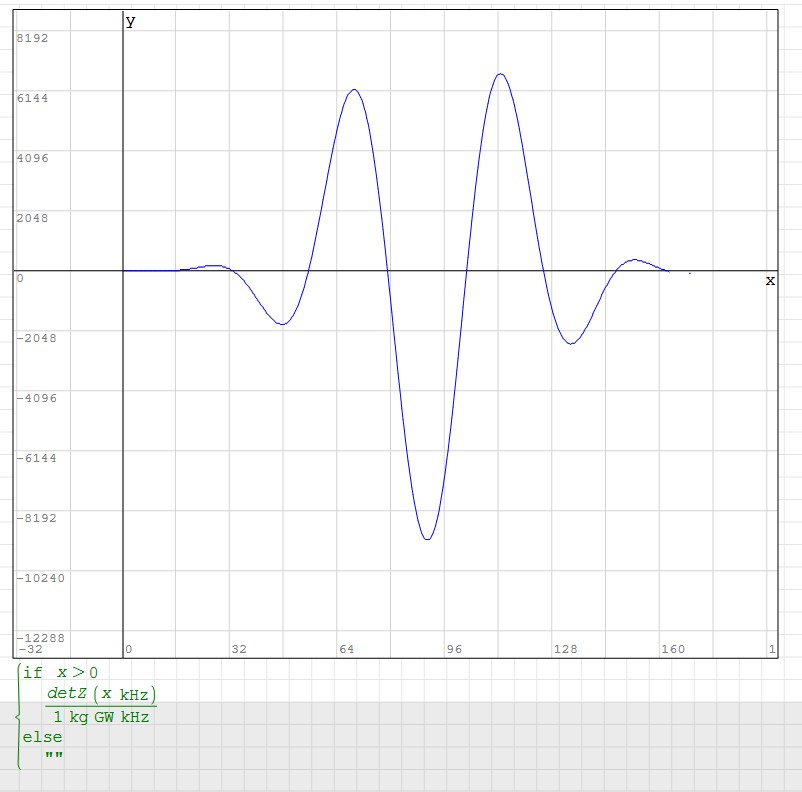
More, I tried to plot (with XY plot) the function for values higher than 160kHz; and, yes, something strange is happening for (see below); the same seems not using SMath Plot functionality
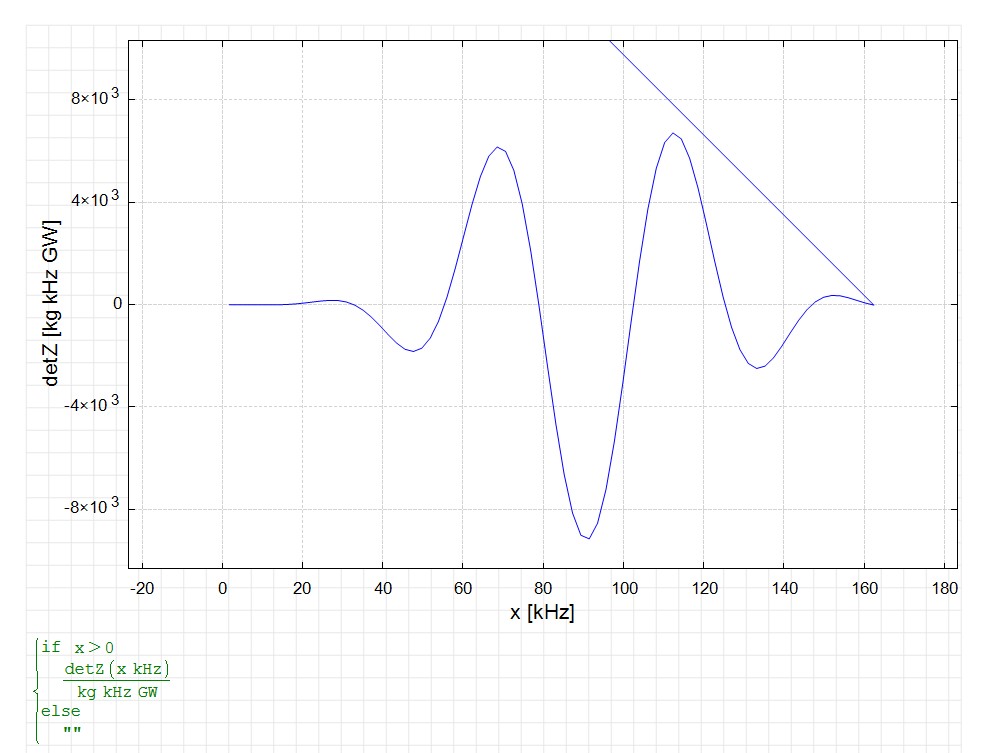
In my specific case, at least, frequencies over 160 kHz are not so critical (the lowest ones are the most worrisome). So, for the moment as said, my problem is solved....next step is to further complexify the function detZ (Omega)...
It's well true that SMath is somewhat tricky, but, honestly, last MathCAD versions are not so error-free as it could be expected.....
Hope that your posts and my small tests/replies can be useful for other forum users.
Best Regards
Fabio
WroteIn any case, it seems to me that each SMath installation has its own combination of "tricks" working (or not working...).
You can't be more right ! Since Studio is replaced by Solver 30405.
Most annoying are dead functions from fx menu.
minor(M,#) undefined, median undefined, medfit in the blue
slope(vx,vy) divide by 0, intercept(vx,vy) divide by 0.
More puzzling, per say, minor(M,#) works native Studio 6179/Solver 30405
On new Solver sheet minor(M,#) function is not defined.
That is detrimental wrt determinant.
Fortunately, most user codes work Solver 30405.
WroteMore, I tried to plot (with XY plot) the function for values higher than 160kHz; and, yes, something strange is happening for (see below); the same seems not using SMath Plot functionality
I asked that phenomenon to uni (author of XY Plot plugin).
It is caused by an algorithm to speed up plotting process.
If it really bothers you (it bothers me), there is a trick.
You can eliminate it by setting different start and end parameters.
Regards
WroteMore, I tried to plot (with XY plot) the function for values higher than 160kHz; and, yes, something strange is happening for (see below); the same seems not using SMath Plot functionality
Your 2nd plot looks a distorted Morlet.
In the attached you will have to reconstruct both graphs.
set sigma:= sqrt(16) ... span 'x' 2nd plot for convenience.
Plot X_Y ± 16 perfect.
Cheers ... Jean.
0Appendix Morlet.sm (14,43 КиБ) скачан 1420 раз(а).
For Overlord: what you propose, works but....have a look here below.....Файл не найден.Файл не найден.
The function seems to me too complex to make a study of the function (I mean limits, derives, max, min); but I'd like
to perform such a study 'cause I expect an "asymptotic" behavior for values higher than 162kHz (last zero)...maybe it's
this asymptotic behavior at the basis of the "strange" plot.
For Jean: interesting, I discovered something!! And even strange because.....my function comes from vibration of short hollow beams.
Best Regards and thanks again
WroteThe function seems to me too complex to make a study of the function (I mean limits, derives, max, min); but I'd like
to perform such a study 'cause I expect an "asymptotic" behavior for values higher than 162kHz (last zero)...maybe it's
this asymptotic behavior at the basis of the "strange" plot.
For Jean: interesting, I discovered something!! And even strange because.....my function comes from vibration of short hollow beams.
Lots of maths are not compatible with units.
Can you explicit the project in simple f(x)
attach an image so to code Solver 30405
I doubt it will accept symbolic Derivative
No problem to Derive via Infinitesimal Analysis.
No problem for min/max Golden ratio.
Cheers ... Jean.
But now focus is on complexifying the problem (and relevant calculation times...).
You can make a calculation for a piecewise beam (instead than for a single beam):
you have just to multiply all the matrix Phi (you obtain for each piece of beam) each other...
Then the treatment is the same for the matrix you obtain as explained above.
For the moment I remark long time (longer than for Mathcad that arrived to process
30-pieces beam in 1h and 30')...I'm trying to "explicitate" and cut the functions
that I used to express implicitly....if suggestions, I'll be glad to test in practice!
Best Regards
Fabio
Best Regards
TMMT without maxima.sm (113,77 КиБ) скачан 1442 раз(а).
Best Regards.
Alvaro.
- Новые сообщения
- Нет новых сообщений