1 страниц (19 вхождений)
Graphs for the control tasks - graph from point to point - Сообщения
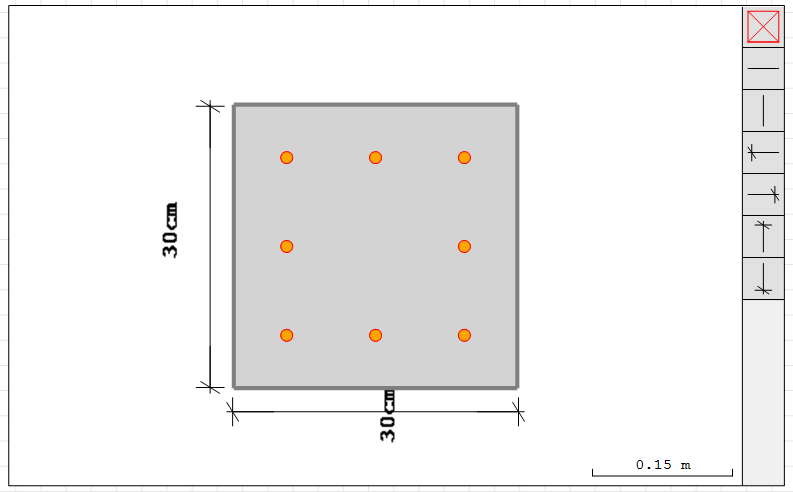
Hi, I want to set my label to vertical dimension but when I rotate the text it gets distorted, please how can I fix it?
Hello.
Tell me, please, if I have two points, then how can I plot a graph between them? According to my assignment, I need to build several graphs, but I do not know how to do it in the program. I have done the calculations, but for the rest I ask for help from local experts. I attach a sheet with the task and a file with calculations (sorry, that's in Russian). Can someone help me figure it out here?

DPT s NV.sm (19,52 КиБ) скачан 1182 раз(а).
Mekhanicheskie kharakteristiki DPT s nezavisimym vozbuzhdeniem.docx (95,56 КиБ) скачан 590 раз(а).
Tell me, please, if I have two points, then how can I plot a graph between them? According to my assignment, I need to build several graphs, but I do not know how to do it in the program. I have done the calculations, but for the rest I ask for help from local experts. I attach a sheet with the task and a file with calculations (sorry, that's in Russian). Can someone help me figure it out here?
DPT s NV.sm (19,52 КиБ) скачан 1182 раз(а).
Mekhanicheskie kharakteristiki DPT s nezavisimym vozbuzhdeniem.docx (95,56 КиБ) скачан 590 раз(а).
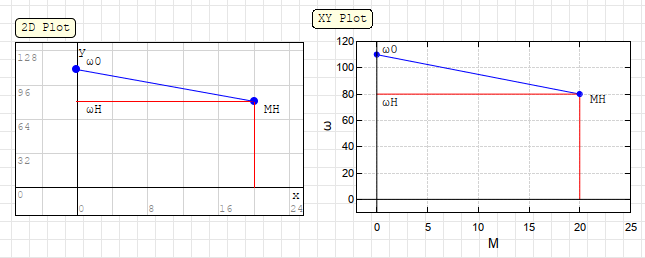
I made a sample with two different plots.
You can use them by changing variables.
Regards
DPT_NV plot.sm (11,08 КиБ) скачан 1137 раз(а).
You can use them by changing variables.
Regards
DPT_NV plot.sm (11,08 КиБ) скачан 1137 раз(а).
1 пользователям понравился этот пост
TopUser2000 26.02.2023 15:06:00
TwoPointsPlot.sm (11,84 КиБ) скачан 1121 раз(а).
1 пользователям понравился этот пост
TopUser2000 27.02.2023 05:03:00
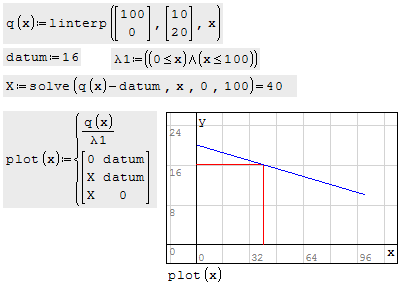
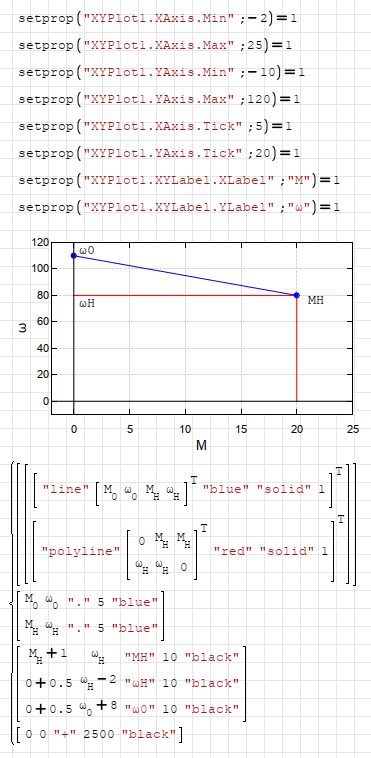
You can also use line and polyline commands for plot.
They work only in XYPlot, but sometimes they make everything easy.
There is also a setprop() function.
It can change format of your XYPlot automatically.
Search setprop() in forum for further information.
Regards
DPT_NV plot.sm (20,47 КиБ) скачан 1284 раз(а).
They work only in XYPlot, but sometimes they make everything easy.
There is also a setprop() function.
It can change format of your XYPlot automatically.
Search setprop() in forum for further information.
Regards
DPT_NV plot.sm (20,47 КиБ) скачан 1284 раз(а).
1 пользователям понравился этот пост
TopUser2000 27.02.2023 05:03:00
Thanks to everyone. The first answer helped me enough)
One more question:
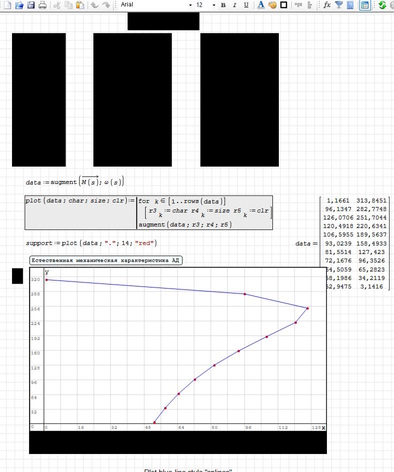
if I have a graph (attached file), then how do I mark the points along which it passes?
I tried: vector M(s) ω(s) "." 15 "blue"
but the application immediately crashes.
AD.sm (20,17 КиБ) скачан 1104 раз(а).
Is it possible to make the graph automatically scale to the new values?
And does someone use android version of Smath (from this site)? I can't edit any of these files there.
One more question:
if I have a graph (attached file), then how do I mark the points along which it passes?
I tried: vector M(s) ω(s) "." 15 "blue"
but the application immediately crashes.
AD.sm (20,17 КиБ) скачан 1104 раз(а).
Is it possible to make the graph automatically scale to the new values?
And does someone use android version of Smath (from this site)? I can't edit any of these files there.
WroteIf I have a graph (attached file), then how do I mark the points along which it passes?
As in the attached.
Instead of re-scaling the same graph, plots all new graph on the same plot.
You will scale to accommodate for the larger graph.
Cheers ... Jean
AD Plot Points.sm (104,39 КиБ) скачан 1188 раз(а).
1 пользователям понравился этот пост
TopUser2000 27.02.2023 15:08:00
I'm afraid it's too difficult for me)
Is there any simple way to add the pass points and autoscale a graph?
Is there any simple way to add the pass points and autoscale a graph?
WroteIs there any simple way to add the pass points and autoscale a graph?
Some Smath versions decided that opening in other versions will be black.
1. Open this document
2. If black, select by groups, click on background white
3. Make the all document as per 2. directive
4. at this point, you have recovered my original
5. Plot points and more advanced.
Cheers ... Jean
AD Plot Points TopUser2000.sm (87,24 КиБ) скачан 1117 раз(а).
1 пользователям понравился этот пост
TopUser2000 27.02.2023 15:08:00
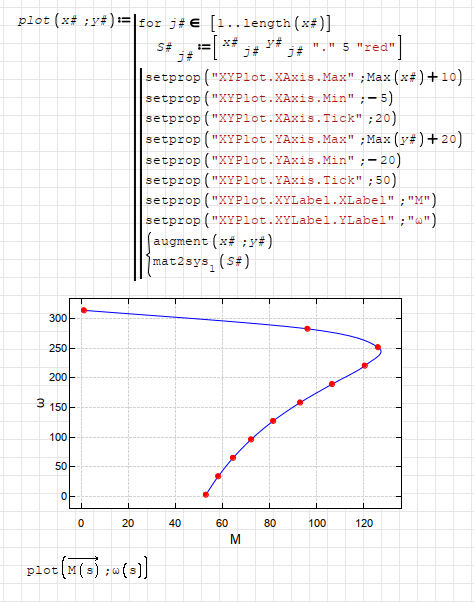
You can use this, XYPlot region is suitable.
One custom function to plot everything.
It also autoscale the graph.
Regards
AD.sm (28,23 КиБ) скачан 1092 раз(а).
One custom function to plot everything.
It also autoscale the graph.
Regards
AD.sm (28,23 КиБ) скачан 1092 раз(а).
1 пользователям понравился этот пост
TopUser2000 27.02.2023 15:08:00
Oh... What literature can I read about making plots in?

Нужно в YouTube в поиске набрать: SMath Studio tutorial и применить фильтр плейлистов. Там найдётся около 4-5 видеокурсов. Можно отфильтровать по продолжительности.
Также каждый дополнительный компонент (расширение) имеет здесь на форуме свою тему, где в начале обычно приложены примеры типового использования.
Также каждый дополнительный компонент (расширение) имеет здесь на форуме свою тему, где в начале обычно приложены примеры типового использования.
Russia ☭ forever, Viacheslav N. Mezentsev
Тут вроде самый необходимый минимум мне описали, но, казалось бы, простую задачу, когда на графике надо проставить точки, тут описывают каким-то сложным для меня способом. Причем, среди кучи текста непонятно, что именно отвечает за эти точки.
Да и с автомасштабом графика я так и не понял.
Да и с автомасштабом графика я так и не понял.
По точкам нужно просто посмотреть примеры использования графиков.
setprop() - функция устанавливает свойство компонента. Возвращает 1, если свойство найдено и успешно установлено, иначе 0.
Она ищет компоненты на всех листах с указанным именем и меняет указанное свойство. Набор доступных для изменения свойств ограничен.
Точки также можно включить в свойствах кривой. ПКМ на компоненте и выбрать настройки, далее зайти в свойства кривой и там выбрать тип маркеров вместо пустого.
В компоненте XYPlot нет автомасштаба, поэтому пока так.
Russia ☭ forever, Viacheslav N. Mezentsev
Wrote
Oh... What literature can I read about making plots in ?
Download first document @ post 10 ... let's see if it works ?
This is what uni cleverly mentioned.
Which I totally forgot its existence.


Which I totally forgot its existence.
2 пользователям понравился этот пост
WroteWrote
Oh... What literature can I read about making plots in ?
Download first document @ post 10 ... let's see if it works ?
Now it works but anyway this way is too difficult for me
WroteNow it works but anyway this way is too difficult for me
Glad it works from doctoring the black.
Nothing is too difficult for Smath Community to which you now belongs.
Your very first document, populate more for standard reference project.
If you just have some experimental points you can't escape Hermite.
It was used long time ago for Mollier.
Hermite cubic interpolation is more ancient than my Mathcad 8 Pro.
Take care ... Jean
1 пользователям понравился этот пост
TopUser2000 05.03.2023 13:02:00
1 страниц (19 вхождений)
- Новые сообщения
- Нет новых сообщений