iterative process - Сообщения
WroteThe plots of N.γ(0.9,atan(x)) and N.γ(0.95,atan(x)) has an odd shape when they approach x=1. It turns out there are some complex solutions in this area.
Is there anything to be done about this, to make the graph closer resemble the diagram?
This is a good observation, I did catch it but didn't mention.
Yes the system generates some complex values, can't track it back
in the generating algo. Will have another look.
The atan(,) from numerical libraries does not generate complex.
That's why you had no plot initially, complex blinds the Quick plot.
Cheers ... Jean
Wrote
This is a good observation, I did catch it but didn't mention.
Yes the system generates some complex values, can't track it back
in the generating algo. Will have another look.
The atan(,) from numerical libraries does not generate complex.
That's why you had no plot initially, complex blinds the Quick plot.
Cheers ... Jean
Another interesting observation is that j.lim in the even Numbers generates values in the areas mentiod that are far too big, while odd j.lims generate conservatively small values.
I really appreciate all the help I can get with this.
Cheers.
WroteIs there anything to be done about this, to make the graph closer resemble the diagram?
This is a good observation, I did catch it but didn't mention.
Yes the system generates some complex values, can't track it back
in the generating algo. Will have another look.
The atan(,) from numerical libraries does not generate complex.
That's why you had no plot initially, complex blinds the Quick plot.
Cheers ... Jean
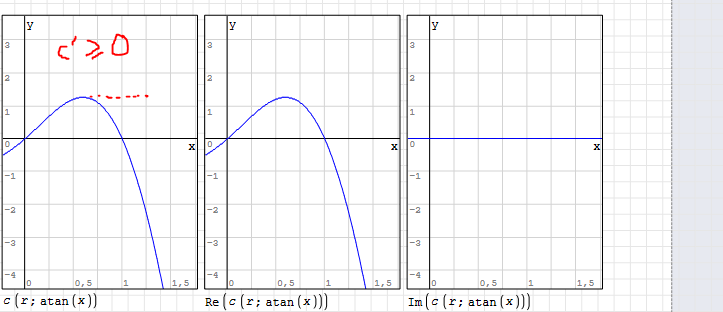
Take a look at this sheet, where every factor of the equation has been ploted separately.
It seems the complex numbers starts with X.c before the iterations start, due to c going negative.
EDIT: It seems in order to produce a plot similar to that of the diagram, dc/dx can not be allowed to be negative. How would I be able to manipulate this?
Cheers.
problem_complex_separated_5.sm (319,66 КиБ) скачан 935 раз(а).
In many more projects, residuals complex have been observed
where the maths do not generate complex. The numerical Smath
engine is in cause. In other applications Smath 32 bits is too granular.
Your project is a two time constants XFR [Transfer Function],
associated wrt the composite process gain Kp. That is much different
than XFR in Process Control Techniques. Maybe the model is ill posed.
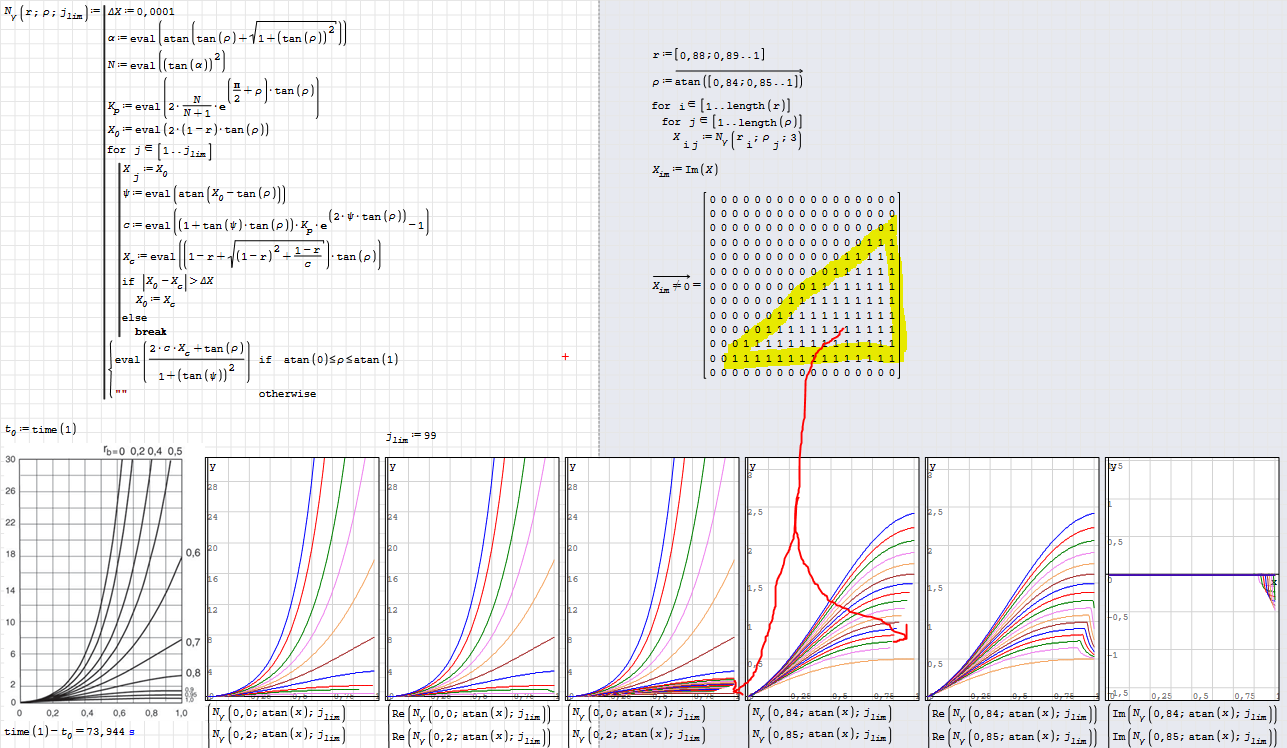
In the mean time, by pushing j 1..99 we get a much better recovery.
Cheers ... Jean
Project Hanski Soil Drainage.sm (516,23 КиБ) скачан 956 раз(а).
Project Hanski Soil Drainage.sm (517,16 КиБ) скачан 999 раз(а).
Wrote... this version is suggestive of completing the project.
Project Hanski Soil Drainage.sm (517,16 КиБ) скачан 999 раз(а).
JMG - great tip to put eval() on all the lines inside the function, sped up the computation considerably, far beyond just right clicking and choosing numeric evaluation.
I think unless someone on the forum can find a way to differentiate c, I will stop pursuing this further.
I have attached a new sheet with my final findings of this function. In my furter application of N.gamma i will have the function output only real values of the solution, and use deltaX = 0,0001 and j.lim = 99.
Thanks to everyone for the help.
Cheers.
problem_complex_separated_6.sm (280,93 КиБ) скачан 889 раз(а).
j.lim 39 is as good as j.lim 99 ... much faster.
Should be same in your machine and SS version.
Cheers, thanks ... Jean.
Project Hanski Soil Drainage Ng.sm (295,27 КиБ) скачан 934 раз(а).
Back at it again, I am now trying to plot these functions in Zedgraph with a log scale.
I've found that "if" within the function is not supported by Zedgraph ("x is not defined") and "cases" breaks the iteration process.
Is there any way to make zedgraph plot my function?
WroteIs there any way to make zedgraph plot my function?
log scale 'y' deteriorates the reality. The project is in two different plots.
Easy to add labels for the part of large deviations, like this demo.
IMHO, much better for publishing the reality. You can label part two as well.
Cheers ... Jean
Project Hanski Soil Drainage Ng.sm (313,4 КиБ) скачан 914 раз(а).
WroteWroteIs there any way to make zedgraph plot my function?
log scale 'y' deteriorates the reality. The project is in two different plots.
Easy to add labels for the part of large deviations, like this demo.
IMHO, much better for publishing the reality. You can label part two as well.
Cheers ... Jean
Thanks Jean for your reply, but it doesnt quite solve my problem.
Attached is a sheet showing what I want to achieve, and explaining the troubles I have trying to do that.
Best regards,
problem_log.sm (691,53 КиБ) скачан 962 раз(а).
You can log scale the calculated ordinates, example attached.
Cheers ... Jean
Project Hanski Soil Drainage Ng.sm (321,38 КиБ) скачан 932 раз(а).
WroteX_Y plots reject conditional. Try to remove them in the program.
You can log scale the calculated ordinates, example attached.
Cheers ... Jean
But the program needs the conditional due to the iteration process I think.
I will have a look into Maxima to see if that gives me what I want.
On the other hand, I have found another method to calculate Ngamma. I have tried to write a similar program to this method, but when I plot this method it differs vastly from the first method/original diagram. Can someone please have a look and check if the setup for method 2 is correct?
Thanks.
Method 1 vs Method 2.sm (459,04 КиБ) скачан 942 раз(а).
Project Hanski Soil Drainage Ng User.sm (313 КиБ) скачан 936 раз(а).
WrotePlease, visit what I just posted under "Uni" ZedGraph.
Thanks Jean, and everyone else who has spent their time trying to figure this out with me.
I think I have come as far as I can on this project, and a lot of new cool smath stuff has been learned.
What an amazing program and community!
Cheers.
WroteWhat an amazing program and community!
Please visit the just posted latest brew in ZedGraph thread.
For our education: what are r, ρ, Nγ ???
'r' percolation factor ?
'ρ' the unary radius ?
'Nγ' some spread ?
No such thing as soil drainage function in the web !
Thanks, cheers ... Jean
Wrote
Please visit the just posted latest brew in ZedGraph thread.
For our education: what are r, ρ, Nγ ???
'r' percolation factor ?
'ρ' the unary radius ?
'Nγ' some spread ?
No such thing as soil drainage function in the web !
Thanks, cheers ... Jean
Nγ is a factor used in the following equation to calculate soil bearing capacity.
σ.v + a = N.q*(p' + a) + 0,5*N.γ*γ'*B.0
r = is roughness of the foundation surface, and ρ = internal friction angle of the soil.
https://www.geostru.eu/blog/2016/06/20/bearing-capacity-for-shallow-foundations/
Cheers.
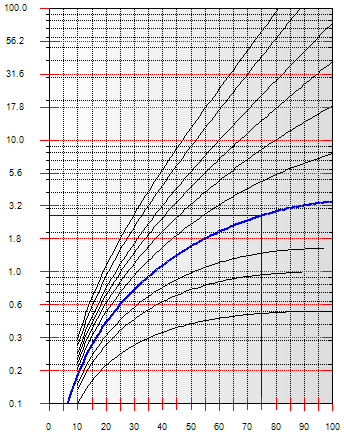
You can create an interpolated blue track trace, read Nγ on the plot.
I'm not completely happy of the Y log, however immaterial for application.
Thanks Hanski for enriching the Smath Community
Jean ... last brew attached.
Project Hanski Soil Drainage Ng ZedGraph.sm (399,09 КиБ) скачан 1008 раз(а).
WroteThanks for the details. As is, the project is complete.
You can create an interpolated blue track trace, read Nγ on the plot.
I'm not completely happy of the Y log, however immaterial for application.
Thanks Hanski for enriching the Smath Community
Jean ... last brew attached.
The whole business of ploting the function is just for documentation purposes, to make sure the function is correct (compared to the referenced diagrams).
In practical application, only the function will be used.
I think the whole problems is ill posed, as you suggested earlier, as evidenced by the complex results. I have made a modification to the function to combat this in my final version of this function.
Attached is the document I will be storing on my server for future reference/use on projects.
Best regards,
project_complete.sm (943,93 КиБ) скачан 936 раз(а).
WroteI have made a modification to the function to combat this in my final version of this function.
I will visit later tomorrow.
In the mean time, if you like this ZedGraph plot ... attached.
Cheers ... Jean
Project Hanski Soil Drainage Ng ZedGraph.sm (519,73 КиБ) скачан 1041 раз(а).
WroteAttached is the document I will be storing on my server for future reference/use on projects.
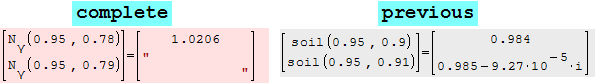
Your latest "complete" does not calculate same values ?
Much shorter in real values. For the remaining of the project, all red SS 6179.
Can't even copy/paste algo in same document, neither export.
- Новые сообщения
- Нет новых сообщений