iterative process - Сообщения
I need help with a iterative calculation. This is my first time trying to build a iterative loop in SMath.
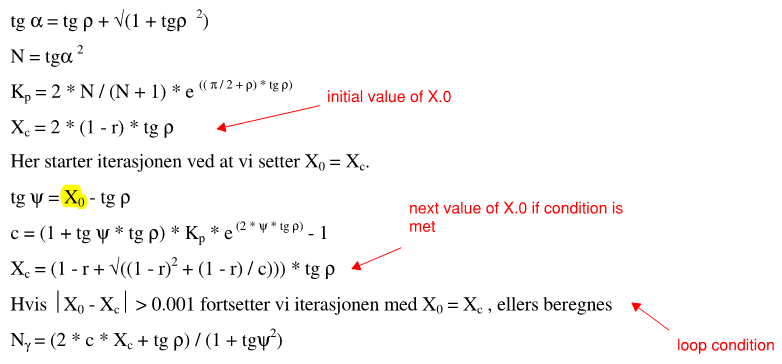
I need to calculate a coefficient that can only be calculated when the difference between X.0 and X.c is below a limit.
I am trying to solve this as a function of r and rho.
Can someone help me get started on how to formulate the iteration?
problem.sm (11,9 КиБ) скачан 959 раз(а).
Best regards,
I need the output X to be a function of r and rho. Is that possible?
Some random questions...
1. why do you use arctg instead of atan?
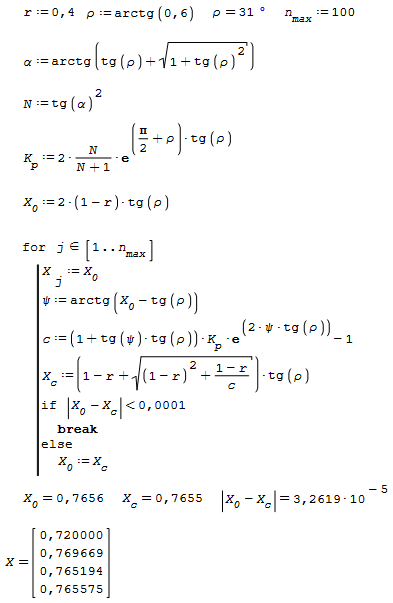
2. does the iterative process have to be wrapped into a for loop where you need to give it a range, and ultimately an upper boundry (n.max)?
WroteThank you for your suggestion Martin!
I need the output X to be a function of r and rho. Is that possible?
Some random questions...
1. why do you use arctg instead of atan?
2. does the iterative process have to be wrapped into a for loop where you need to give it a range, and ultimately an upper boundry (n.max)?
0. I think you would need to wrap the full procedure into a function of r and rho with X as return value. Alternatively, you might come up with a recursive definition of the procedure.
1. It is just the setting world versus european style for functions. It is the same function, just displayed according to the GUI settings.
2. the for loop just came in handy for generating the indices for storage of iteration history. You could use while 1 as well. I also thought it was a good idea to have an upper limit for the iterations in case the algorithm might diverge.
WroteWroteThank you for your suggestion Martin!
I need the output X to be a function of r and rho. Is that possible?
Some random questions...
1. why do you use arctg instead of atan?
2. does the iterative process have to be wrapped into a for loop where you need to give it a range, and ultimately an upper boundry (n.max)?
0. I think you would need to wrap the full procedure into a function of r and rho with X as return value. Alternatively, you might come up with a recursive definition of the procedure.
1. It is just the setting world versus european style for functions. It is the same function, just displayed according to the GUI settings.
2. the for loop just came in handy for generating the indices for storage of iteration history. You could use while 1 as well. I also thought it was a good idea to have an upper limit for the iterations in case the algorithm might diverge.
Thanks again for the replies, on a friday night no less. I really appreciate that!

0. Can you explain this in layman terms? Ultimately, I want to graph N.gamma as a function of r and rho, where I have 10 set values of r and 10 corresponding functions plotted with rho along x-axis.
1. OK. I was just curious if they were different functions, like max/Max for example, which I have found can make or break a book.
2. thanks again for the explanation.
Cheers
WroteI need the output X to be a function of r and rho. Is that possible?
Sorry, don't understand.
If you want to see the evolution of the solution, use a while loop,
SQRT(x) in Samples is a good example.
Visit Golden ratio as well.
problem_Kr Plot What.sm (17,85 КиБ) скачан 1010 раз(а).
WroteWroteI need the output X to be a function of r and rho. Is that possible?
Sorry, don't understand.
If you want to see the evolution of the solution, use a while loop,
SQRT(x) in Samples is a good example.
Visit Golden ratio as well.
problem_Kr Plot What.sm (17,85 КиБ) скачан 1010 раз(а).
Hi Jean,
Thanks for the sample.
I think I got my calculation working now with (a lot) of help from Martin.
I cant plot N.gamma(r, rho) because it obviously takes an enormous amount of computational power.
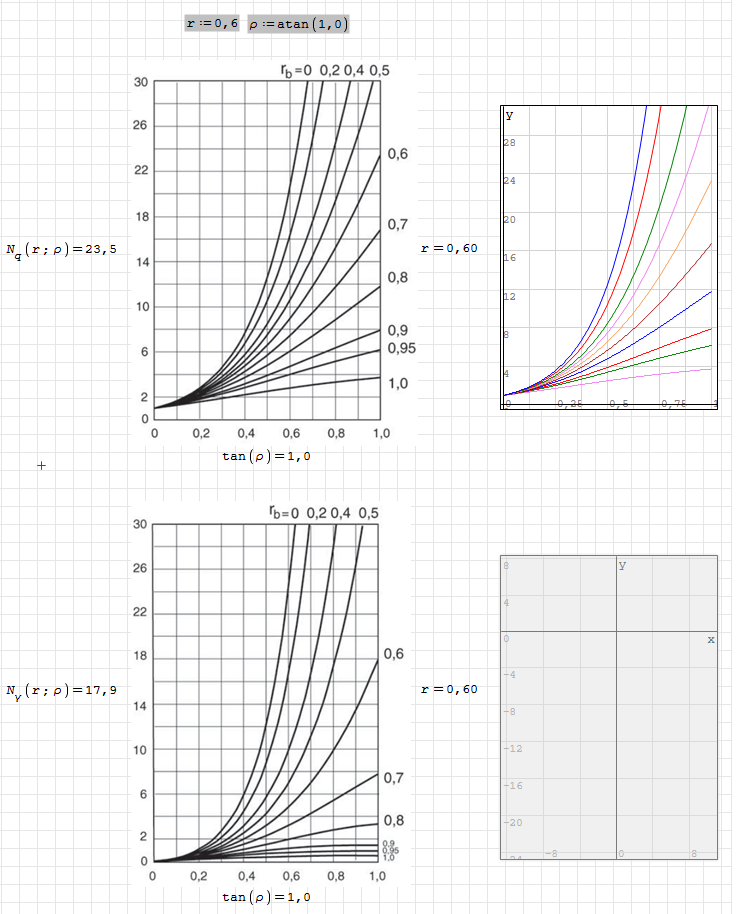
However, the formulas seem to return the correct value when you compare to the diagrams in this sheet (the benchmark for my calculation).
PS. Is there some way to speed up the calculation of N.gamma? For some values of r and rho it can take Almost a minute to compute.
Cheers
problem_solved.sm (511,22 КиБ) скачан 962 раз(а).
WroteI cant plot N.gamma(r, rho) because it obviously takes an enormous amount of computational power.
Get a quick insight ... that you can mesh finer.
problem_solved More Insight.sm (517,45 КиБ) скачан 968 раз(а).
Wrote
I think I got my calculation working now with (a lot) of help from Martin.
I cant plot N.gamma(r, rho) because it obviously takes an enormous amount of computational power.
However, the formulas seem to return the correct value when you compare to the diagrams in this sheet (the benchmark for my calculation).
PS. Is there some way to speed up the calculation of N.gamma? For some values of r and rho it can take Almost a minute to compute.
Cheers
There is no need to define the quantities as explicit functions if you just want to evaluate an expression. Removing the arguments together with setting the whole algorithm to numeric optimization in the context mnenu made a speedup from 30s to 3s.
problem_solved_Kr.sm (509,24 КиБ) скачан 954 раз(а).
![2020-10-03 09_36_55-SMath Studio - [problem_solved.sm_].png](/ru-RU/files/Download/gwKM8k/2020-10-03-09_36_55-SMath-Studio---[problem_solved.sm_].png)
WroteWrote
I think I got my calculation working now with (a lot) of help from Martin.
I cant plot N.gamma(r, rho) because it obviously takes an enormous amount of computational power.
However, the formulas seem to return the correct value when you compare to the diagrams in this sheet (the benchmark for my calculation).
PS. Is there some way to speed up the calculation of N.gamma? For some values of r and rho it can take Almost a minute to compute.
Cheers
There is no need to define the quantities as explicit functions if you just want to evaluate an expression. Removing the arguments together with setting the whole algorithm to numeric optimization in the context mnenu made a speedup from 30s to 3s.
Can you help me understand understand the difference between having the quantities as explicit functions like I did and your approach, and what will the advantange/disadvantages be for one or the other? I want to try to understand the best way to structure my calculations for the result I want.
BTW, just installed the latest SMath version, what a tremendous speedup that gave on this sheet. My oldere version would go on for minutes without being able to plot N.gamma.
Thanks
Wrote
Can you help me understand understand the difference between having the quantities as explicit functions like I did and your approach, and what will the advantange/disadvantages be for one or the other? I want to try to understand the best way to structure my calculations for the result I want.
BTW, just installed the latest SMath version, what a tremendous speedup that gave on this sheet. My oldere version would go on for minutes without being able to plot N.gamma.
Thanks
I am on very thin ice when making statements on that, because it is just based on observations, not on conceptual insight.
If you define functions, these are stored as is and evaluated when the function is called. If define a variable, the expression is simplified using the current context (available definitions of variables) You can see that in the debugger window.
You always see what you store in the dynamic callout when hovering over the definition.
I know that in the end you want a quantity depending on r and rho, thus a function. Yet, inside the algorithm r and rho are fixed and not subject to change for a given call of that algorithm. So it is straightforward to use the global value of these variables throughout the algorithm, specified as arguments when calling the algorithm.
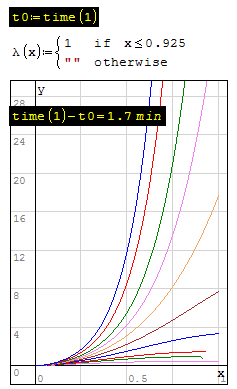
WroteMy oldere version would go on for minutes without being able to plot N.gamma.
My steam engine laptop SS 6179 runs Martin in 1.8 min.
It runs the solver 168*10= 1680 for all 10 plots
Set j=9 ... constrain gamma 0.9 reluctant
Set the solver in eval(,) mode.
Cheers ... Jean
problem_solved_Kr Sanity.sm (510,04 КиБ) скачан 1012 раз(а).
Saved in my Project file ... any abstract about the project ?
Project Hanski Unknown.sm (513,66 КиБ) скачан 961 раз(а).

WroteN.γ(r,ρ) should plot in ~ 30 s on modern machines.
Saved in my Project file ... any abstract about the project ?
Project Hanski Unknown.sm (513,66 КиБ) скачан 961 раз(а).
Calculated in about 5 seconds on the latest stable SMath Studio.
WroteWroteMy oldere version would go on for minutes without being able to plot N.gamma.
My steam engine laptop SS 6179 runs Martin in 1.8 min.
It runs the solver 168*10= 1680 for all 10 plots
Set j=9 ... constrain gamma 0.9 reluctant
Set the solver in eval(,) mode.
Cheers ... Jean
problem_solved_Kr Sanity.sm (510,04 КиБ) скачан 1012 раз(а).
Calculated in about 2 seconds on the latest stable SMath Studio.
WroteCalculated in about 2 seconds on the latest stable SMath Studio.
Thanks Andrey ... very impressive !
What about Julia set ? Cheers ... Jean.
Pattern Julia Set [PUBLISH].sm (172,79 КиБ) скачан 792 раз(а).
WroteWrote
Can you help me understand understand the difference between having the quantities as explicit functions like I did and your approach, and what will the advantange/disadvantages be for one or the other? I want to try to understand the best way to structure my calculations for the result I want.
BTW, just installed the latest SMath version, what a tremendous speedup that gave on this sheet. My oldere version would go on for minutes without being able to plot N.gamma.
Thanks
I am on very thin ice when making statements on that, because it is just based on observations, not on conceptual insight.
If you define functions, these are stored as is and evaluated when the function is called. If define a variable, the expression is simplified using the current context (available definitions of variables) You can see that in the debugger window.
You always see what you store in the dynamic callout when hovering over the definition.
I know that in the end you want a quantity depending on r and rho, thus a function. Yet, inside the algorithm r and rho are fixed and not subject to change for a given call of that algorithm. So it is straightforward to use the global value of these variables throughout the algorithm, specified as arguments when calling the algorithm.
Thanks, that actually made a lot of sense! Will apply that to other sheets i have that struggle with Slow computation.
Cheers!
WroteN.γ(r,ρ) should plot in ~ 30 s on modern machines.
Saved in my Project file ... any abstract about the project ?
Project Hanski Unknown.sm (513,66 КиБ) скачан 961 раз(а).
The functions calculate soil bearing capacity factors for drained conditions. N.q is used internationally, but N.gamma is according to Norwegian recommendations.
Cheers.
WroteWroteCalculated in about 2 seconds on the latest stable SMath Studio.
Thanks Andrey ... very impressive !
What about Julia set ? Cheers ... Jean.
Pattern Julia Set [PUBLISH].sm (172,79 КиБ) скачан 792 раз(а).
55 seconds. As I see it was about 14 minutes before...
The plots of N.γ(0.9,atan(x)) and N.γ(0.95,atan(x)) has an odd shape when they approach x=1. It turns out there are some complex solutions in this area.
Is there anything to be done about this, to make the graph closer resemble the diagram?
Cheers
problem_complex.sm (260,13 КиБ) скачан 967 раз(а).
- Новые сообщения
- Нет новых сообщений