1 страниц (6 вхождений)
Maxima Draw 2D - Question about Maxima Draw 2D - Сообщения
Hi,
I am a new user of SMath. I mainly use it for control system analysis and drawing Bode plots for transfer functions.
I am trying to figure out how to change the marker for different curves. I use Maxima plugin.
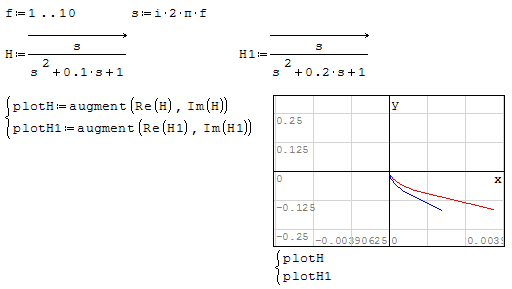
Please see my attached file.
ThanksTF.sm (53 КиБ) скачан 1117 раз(а).
I am a new user of SMath. I mainly use it for control system analysis and drawing Bode plots for transfer functions.
I am trying to figure out how to change the marker for different curves. I use Maxima plugin.
Please see my attached file.
ThanksTF.sm (53 КиБ) скачан 1117 раз(а).
Thanks for your reply.
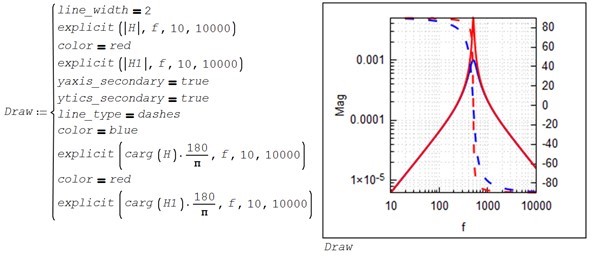
What I was trying to figure out is how to change the marker point for curves for better visualization. I could find out how to changes the line width and color in Maxima as you can see in my file.
It is easy to do it with X-Y plot but I needed log scale and it is available in Maxima.
What I was trying to figure out is how to change the marker point for curves for better visualization. I could find out how to changes the line width and color in Maxima as you can see in my file.
It is easy to do it with X-Y plot but I needed log scale and it is available in Maxima.
Hi. Use line_type≡dashes. Other types are dots, short_dashes, short_long_dashes, short_short_long_dashes and dot_dash
Best regards.
Alvaro.
Best regards.
Alvaro.
2 пользователям понравился этот пост
Thanks so much. This is helpful.
Is there a manual where I can find these different settings and options?
Is there a manual where I can find these different settings and options?
1 страниц (6 вхождений)
- Новые сообщения
- Нет новых сообщений