1 страниц (6 вхождений)
Interaction Diagram - Axial and Bending - How to create an Interaction Diagram for Axial and Bending - Сообщения
I am wondering if anyone can provide some advice on the best way to create an interaction diagram for axial and bending.
For example, a reinforced concrete column.
The basic process to form an interaction diagram is to assume the location of the neutral axis then to perform a bunch of smaller calculations/checks and finally end up with the column axial and bending strength.
If I want to plot these results do I need to set up the calculation so that all these small steps are part of the same 'for loop'?
Or if I want to calculate the moment and axial strength at certain points then plot the result of these points; I suppose I could just repeat (copy/paste) the calculation for each point and record the Moment and Axial capacity then plot these values.
Any thoughts on this?
I can attached a spreadsheet or calc of what I'm trying to accomplish if that would help.
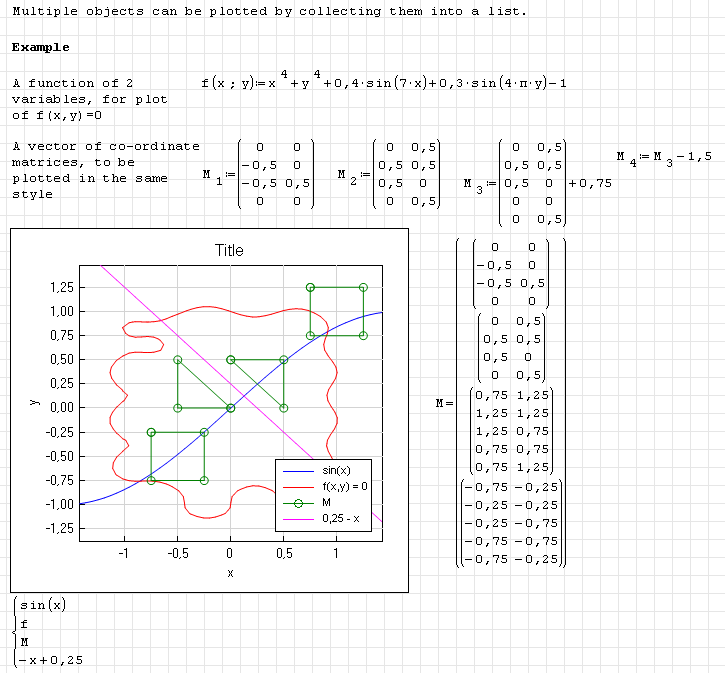
You can compute the moment/axial force pairs individually, append them to a 2 column matrix and plot that matrix. Best results are obtained with the X-Y-Plot plugin by Viacheslav N. Mezentsev (uni).
Technische Mechanik mit SMath Studio: https://link.springer.com/book/10.1007/978-3-658-50592-9
1 пользователям понравился этот пост
IVR 14.11.2013 04:25:00
First, thank you.
Second, quick question, in the 'for' statement shown above (for i from 1 to n+1) how do you get the two periods (the "to" part of it)? What keys are pressed?
Second, quick question, in the 'for' statement shown above (for i from 1 to n+1) how do you get the two periods (the "to" part of it)? What keys are pressed?
a..b is the operator form of the function range(a,b).
Technische Mechanik mit SMath Studio: https://link.springer.com/book/10.1007/978-3-658-50592-9
1 пользователям понравился этот пост
IVR 14.11.2013 04:25:00
Martin,
I'm taking a look at this again...
I seem to be having an issue getting this to plot.
Interaction - Graph.sm (7,35 КиБ) скачан 1328 раз(а).
I'm taking a look at this again...
I seem to be having an issue getting this to plot.
Interaction - Graph.sm (7,35 КиБ) скачан 1328 раз(а).

325 сообщений из 2 052 понравились и 1 не понравились пользователям.
Группа: Moderator
Hello,
What exactly is your issue? As I could see, you just did not change the scale for X-Y plot and therefore did not see your data plotted.
Regards,
Radovan
What exactly is your issue? As I could see, you just did not change the scale for X-Y plot and therefore did not see your data plotted.
Regards,
Radovan
When Sisyphus climbed to the top of a hill, they said: "Wrong boulder!"
1 страниц (6 вхождений)
- Новые сообщения
- Нет новых сообщений