1 страниц (14 вхождений)
[X-Y Plot plugin] region dissappears when ploting - Сообщения
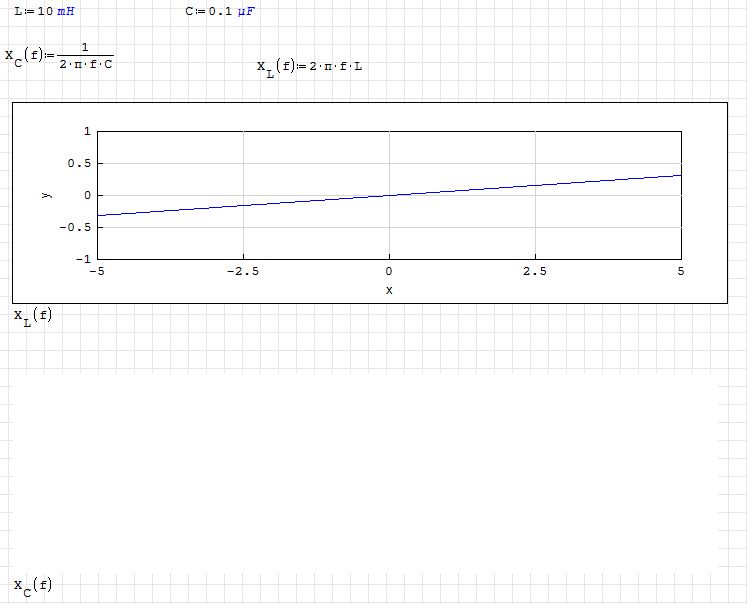
X-Y plot plotting two functions:
Basile
Basile
Hi Basile. A bug without the file could be hard to interpret.
But, unregarding math or bugs, you're trying to use negative frequencies. Are you sure about what could be represent that? Also, a zero frequency, what is it? Direct current?
Frequencies also are usually represented in a log scale.
Best regards.
Alvaro.
But, unregarding math or bugs, you're trying to use negative frequencies. Are you sure about what could be represent that? Also, a zero frequency, what is it? Direct current?
Frequencies also are usually represented in a log scale.
Best regards.
Alvaro.
Alvaro,
All you say about the physics of the problem, you are right.
But look the mathematics, just plotting a function.
Look above, the X.L(f) plots fine.
Similarly plots fine if I use the Plot-2D.
Basile
All you say about the physics of the problem, you are right.
But look the mathematics, just plotting a function.
Look above, the X.L(f) plots fine.
Similarly plots fine if I use the Plot-2D.
Basile
Hi Basile. You discover a couple of nice and unwanted visual special effects in blue. I know near nothing about smath plugins, and can't help about them.
Best regards.
Alvaro.
Best regards.
Alvaro.
Two things Basile:
1. Your unit systen is wrong [L => H, C => F]
2. Xc, XL have nothing to do with an LC circuit.
XL is equal to f(x):= dontknow*x
XC is equal to f(x):= 1/dontknow*x
https://en.wikipedia.org/wiki/LC_circuit
1. Your unit systen is wrong [L => H, C => F]
2. Xc, XL have nothing to do with an LC circuit.
XL is equal to f(x):= dontknow*x
XC is equal to f(x):= 1/dontknow*x
https://en.wikipedia.org/wiki/LC_circuit
Jean,
My system of units is NOT wrong.
Capacitance in Farad
Inductance in Henry
Reactance of both in Ohm.
Basile
My system of units is NOT wrong.
Capacitance in Farad
Inductance in Henry
Reactance of both in Ohm.
Basile

Seems the issue is related to negative infinity
If you like my plugins please consider to support the program buying a license; for personal contributions to me: paypal.me/dcprojects
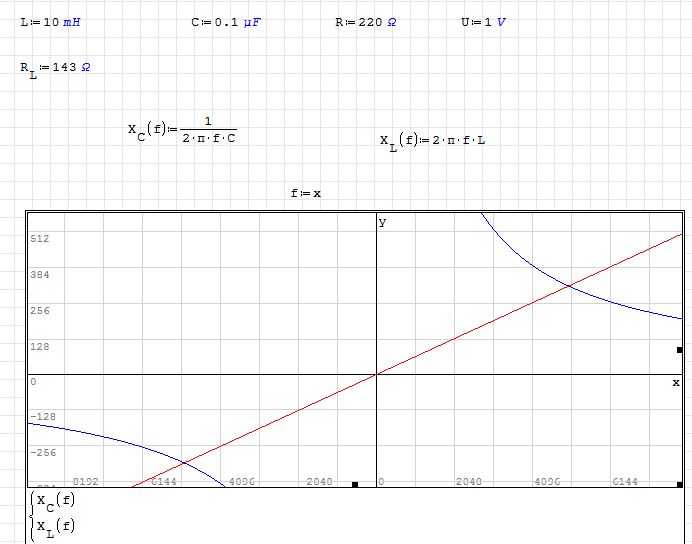
Basile,
What you did is no not correct: You copied the L
plot and put in it the C plot with the same L scales.
So, the C plot flies in the blue. Someting like this:
If you photograph a mouse and an elephant in the same
bed, you won't see both. If you adjust for elephant,
the mouse will be a dot pretty hard to isolate and
enlarge unless you have zillions of MP resolution ...
Jean
Jean,
Yes, it works with the Plot 2D.
The problem is with the X-Y plot. It disappears and freezes the instance of Smath!
As pointed by Davide a possible problem with minus infinity?
Basile
Yes, it works with the Plot 2D.
The problem is with the X-Y plot. It disappears and freezes the instance of Smath!
As pointed by Davide a possible problem with minus infinity?
Basile
WroteThe problem is with the X-Y plot. It disappears and freezes the instance of Smath!
As pointed by Davide a possible problem with minus infinity?
NO => Not as you think. X_Y is not an autoplot, it is a plot range.
If you plot sin(x) it falls in its default XY ranges OK. Otherwise
you have to range both directions. X_Y does not supports few things:
1. It does not plot x. It does not understand that 'x' is implicit
of 'x' = "1*x" neither implicit of 'x' = 'x+0'
2. It supports some common Engineering ranges 1*e ±3 [per say]
but will crash Smath instance if you want to range 1*e ± -15
X_Y is lovely in many projects but not in others.
By increasing the limit values of the function the graph does not
pass through a pivotal point

Bug.sm (8,2 КиБ) скачан 1092 раз(а).
pass through a pivotal point
Bug.sm (8,2 КиБ) скачан 1092 раз(а).
WroteBy increasing the limit values of the function
That's right but not a bug. Just that above the Y magnitude 45,
the canvas misses some points in the critial region.
More: does not fill the circle, plots x instead of +
Jean
X_Y Plot wisely.sm (11,2 КиБ) скачан 1117 раз(а).
1 пользователям понравился этот пост
Fridel Selitsky 29.06.2016 14:37:00
...
1 страниц (14 вхождений)
- Новые сообщения
- Нет новых сообщений