
1页(5条)
X-Y Plot Plugin - Formatting W-Variables - How to set X-Y Limits and Step Size - 消息

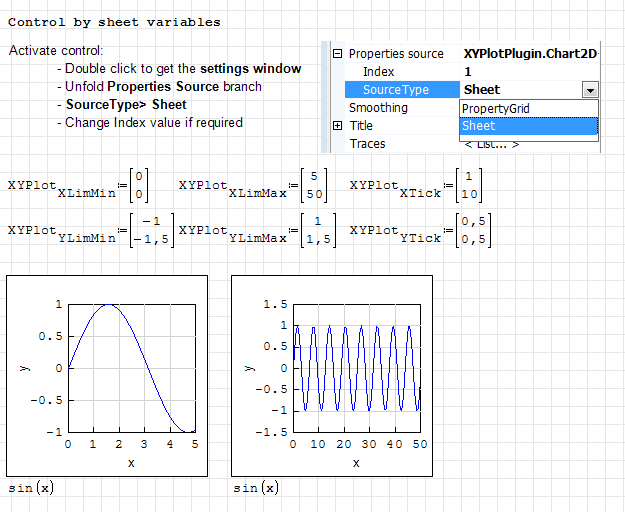
Is it possible to define XLimMax, XTick, etc on the canvas (outside of the Format dialogue box)?
I thought this was possible but I can't seem to get it to work.
Thanks,
Ryan
I thought this was possible but I can't seem to get it to work.
Thanks,
Ryan
WroteIs it possible to define XLimMax, XTick, etc on the canvas (outside of the Format dialogue box)?
I thought this was possible but I can't seem to get it to work.
Only Xmin, Xmax [quick]
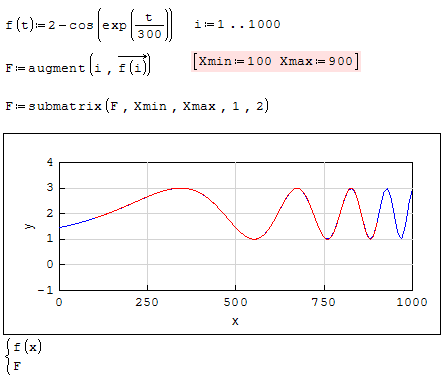
Thanks for the response Jean.
I believe I have worded my question poorly. In your example the "XTick" appears to be 250 and the YTick appears to be 1. This can be adjusted if I right click on the graph and go to format then adjust the "XTick" and "YTick". I am asking if it possible for me assign these variables on the canvas rather than having to go into the format dialogue box.
Hopefully this makes more sense?
Technische Mechanik mit SMath Studio: https://link.springer.com/book/10.1007/978-3-658-50592-9
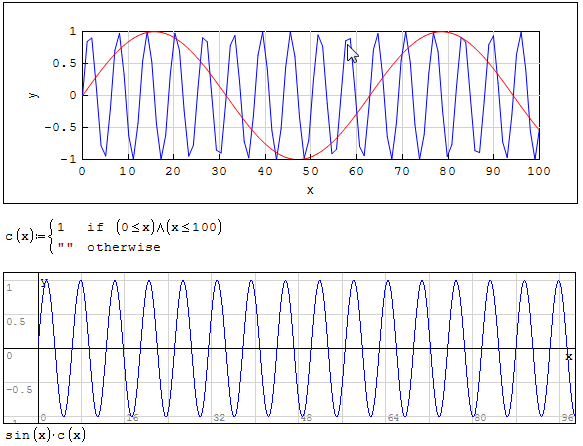
The Smath default quick plot plots values on canvas pixels
i.e: 96 PPI [Pixels Per Inch] ... this is for scalar plot wrt 'x'
X_Y does not understand plotting. To get the fine plot, you must
caliper in PPI the blank plot once stretched. From there, discretize
the ranged function on those number of pixels [scratching the left
ear with the right hand].
i.e: 96 PPI [Pixels Per Inch] ... this is for scalar plot wrt 'x'
X_Y does not understand plotting. To get the fine plot, you must
caliper in PPI the blank plot once stretched. From there, discretize
the ranged function on those number of pixels [scratching the left
ear with the right hand].
1页(5条)
- 有新帖
- 无新帖