X-Y Plot Region - Extends SMath Studio with a X-Y Plot Region. - Messages

QuoteI just downloaded 0.99 and it didn't work out.
Tell me more about what's wrong.
I downloaded your zip file, then copied the two dll files into the plugin folder of smath. When I then start smath I get an error message saying "The remote server returned an error: (407) Proxy Authentication Required".
Sorry I am a newbee. I am not familiar with the procedure for installing plugins. I had used mathcad in the past, and I started working a bit with smath about a year ago. I was looking for a WYSIWYG option, next to python. I do found smath rather convenient but was not so happy with the plotting options so I was curious to see how it would turn out with that plugin.
Thanks for your help.


WroteYou need to use the Extension Manager (from SMath Studio main menu) to install plugins.
This is under Tools > Plugins... > Online gallery
![2018-03-19 14_21_24-SMath Studio - [Page1].png](/en-US/files/Download/owdEQv/2018-03-19-14_21_24-SMath-Studio---[Page1].png)
![2018-03-19 14_21_43-SMath Studio - [Page1].png](/en-US/files/Download/WUqoSS/2018-03-19-14_21_43-SMath-Studio---[Page1].png)
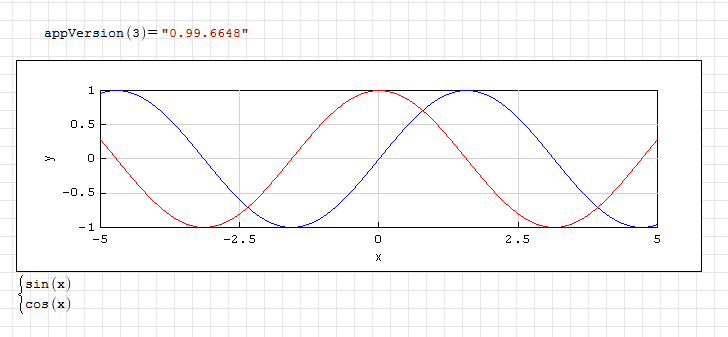
I was plotting the curves and started filling in the table information. The title stuck, but the X and Y labels did not.
I have tried several times, including creating a new graph, to fix these labels and the plugin freezes SMath. I need to enter task manager to end the program. Essentially, the "pop-up" associated with this plugin is not showing up.
XY-Plot Crash.sm (115.16 KiB) downloaded 1265 time(s).
PS, I created a new sheet and inserted a zed graph, pop up came up. I created another new sheet and inserted a blank X-Y graph, it crashed.
Wrote... it crashed.
Quite OK here.
Are you doing something wrong or bug wrt your Smath version ? ?
WroteAre you doing something wrong or bug wrt your Smath version?
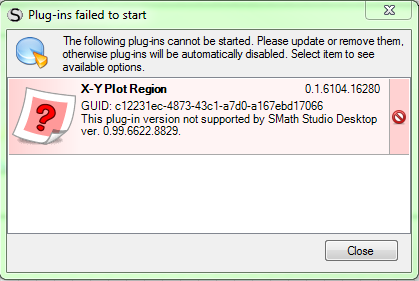
My sheet has the app version. I'm on 0.99.6654. Looks like that may be the problem
WroteMy sheet has the app version.
I'm on 0.99.6654.Looks like that may be the problem
Conclusively, Maxima X_Y is affected by the Smath version.
WroteFound the issue(s). See revamped file. Still having issues in that X-Y plot Labels for the legend *zap*Quick Sound Loss.smz (142.28 KiB) downloaded 1556 time(s).
Edit: Two bugsThis is one of those sheets where UNITS are huge! The equations are all based off of SI/metric references. Major issue
- X-Y Plot. If functions crash, *Zap* to the legend titles. All other titles OK. Legend is empty due to laziness after last 5 crashes
- solve(4) did not like trying to cancel units in the denominator of the final function (#dist). As I was adding units to x:0-100 FT and dividing the units meters in the function, the function crashed in the solve block (Just the function, with all values plugged in except for x = vector, so it's a solve(4) issue).
There is additional documentation and function definition updates. Sanity check the graph x scale (adjusted for feet since I'm in the US). Should be good now
Is XY plot still being actively developed?
I was hoping you can address the image quality when printed to PDF.
I wonder if this is because in onpaint() you convert all the draw calls to bitmap which is further stored displayed and printed. In image region, for a windows native vector EMF file, i draw the EMF directly within onpaint() which makes sure that image looks sharp on both the screen (94 dpi) and printer (300 DPI)
Regards,
AM
WroteI was hoping you can address the image quality when printed to PDF.
PDF quality depends only upon the PDF creator. For free, CutePDF is acceptable.
No idea how it renders hard print because I don't have printer.
TESLA.pdf (59.68 KiB) downloaded 684 time(s).
WroteWroteI was hoping you can address the image quality when printed to PDF.
PDF quality depends only upon the PDF creator. For free, CutePDF is acceptable.
No idea how it renders hard print because I don't have printer.
TESLA.pdf (59.68 KiB) downloaded 684 time(s).
You are not using "X-Y Plot Region" but "2D Plot" in attached PDF; my comment was regarding the "X-Y Plot Region"
WroteYou are not using "X-Y Plot Region" but "2D Plot" in attached PDF; my comment was regarding the "X-Y Plot Region"
No matter X_Y region or QuickPlot ... totally identical from CutePDF.
Doublet.pdf (28.86 KiB) downloaded 667 time(s).
WroteNo matter X_Y region or QuickPlot ... totally identical from CutePDF.
Image of the CutePDF as rendered by Adobe Reader DC.
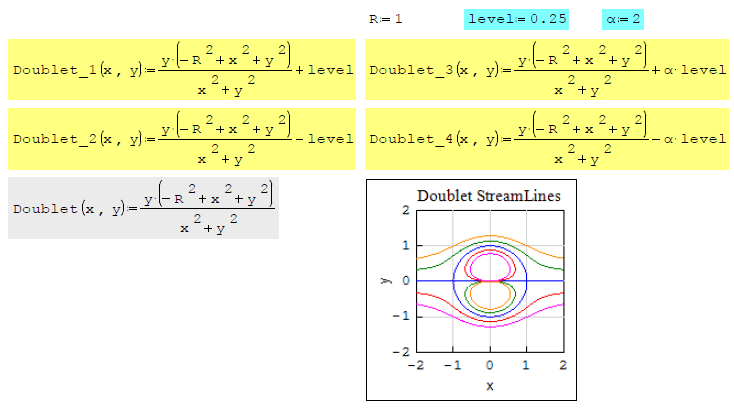
the function text is nice and clear, the plot is pixelated. This is what the issue here.
WroteI wonder if this is because in onpaint() you convert all the draw calls to bitmap which is further stored displayed and printed.
It does look that bitmap is being displayed / printed instead of draw calls
        public override void OnPaint( PaintEventArgs e ) {

            base.OnPaint( e );

            if ( this.InEvaluation ) return;

            Image image = new Bitmap( e.ClipRectangle.Width, e.ClipRectangle.Height );

            Rectangle Rect = new Rectangle( new Point( 0, 0 ), image.Size );

            Graphics g = Graphics.FromImage( image );

            g.FillRectangle( new SolidBrush( Color.White ), Rect );

            cs.ChartArea = Rect;

            cs.AddChartStyle( g, ca, xa, ya, y2a, gd, lb, tl );
            dc.AddCurves( g, cs, xa, ya, y2a );
            lg.AddLegend( g, dc, cs );

            e.Graphics.DrawImage( image, e.ClipRectangle );

            g.Dispose();

        }
Uni, if you have time at some point, could you either supersample bitmap, or draw directly in onPaint() similar to what was done in PieChart:
https://smath.info:8443/!/#public/view/head/plugins/PieChartRegion/PieChartCanvas.cs
Thank you,
Alex M.
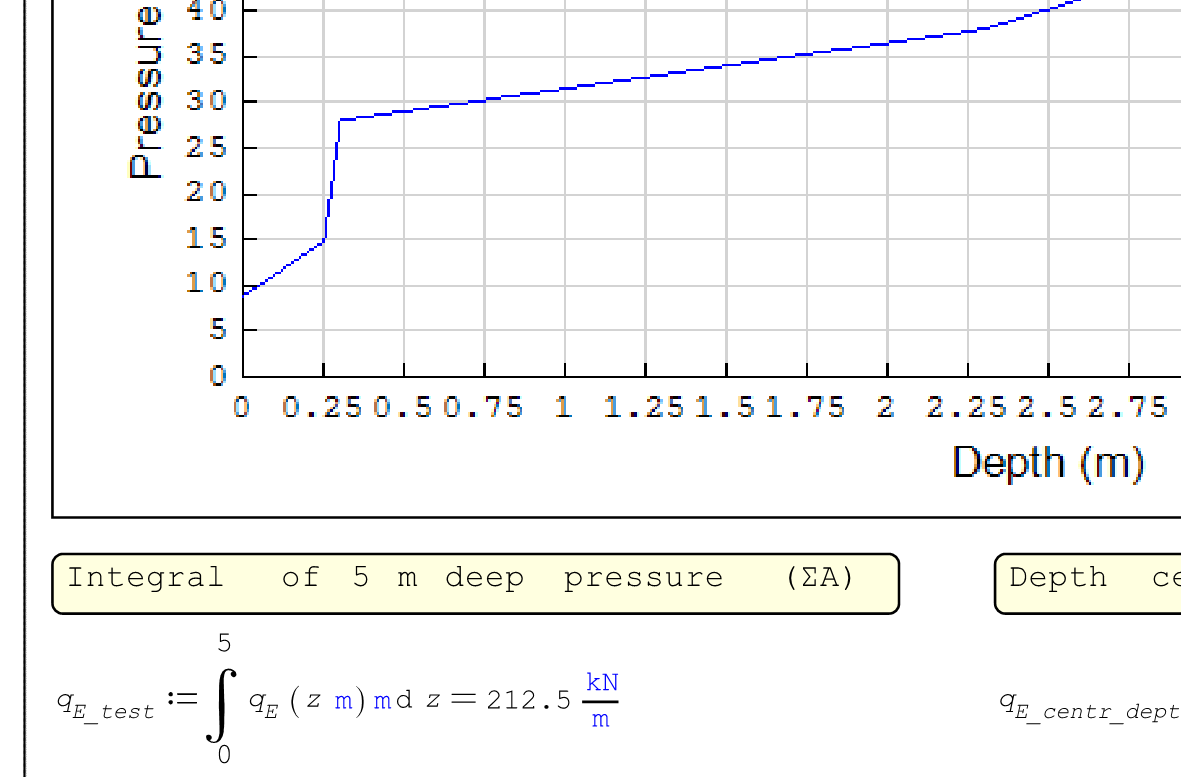
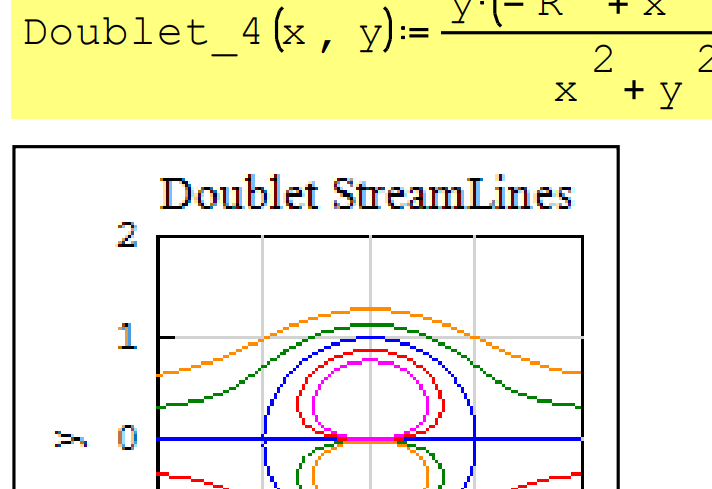
WroteJean, look at zoomed image below from your pdf.
the function text is nice and clear, the plot is pixelated. This is what the issue here.
PDF creators recognize what is coded [text, glyphes like in equation editors ...].
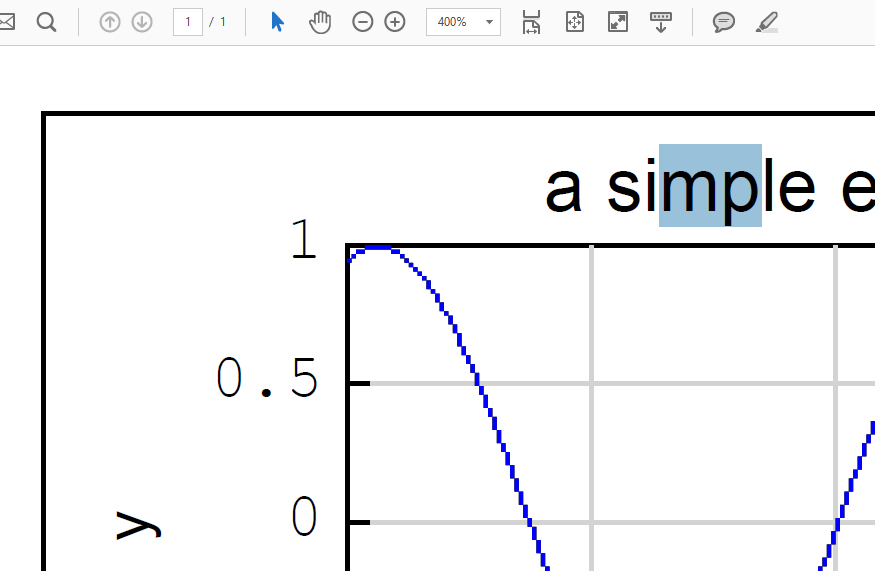
The graphs are not codable and treated as image raster. When you zoom up the PDF
documents, the images are simply pixelated. If you zoom up 400%, each pixel is
quadruplated side by side thus the poor looking. If the graph could be interpreted
as an RGB image, then the PDF reader would have to process/zoom the image from
some type of image subprocessor. That simply does not exist with Adobe Reader.
I'm not aware of PDF creator/reader that process images.
In short: Smath is of no concern in there.
From recollection, my "Nuance PDF creator/reader" would zoom up like an image.
Page1 zoom Doublet.sm (109.41 KiB) downloaded 1513 time(s).
WroteI wonder if this is because in onpaint() you convert all the draw calls to bitmap which is further stored displayed and printed.
Yes this is the cause. Try the following (drag&drop the zip in the canvas - just for testing purposes):
XYPlotRegion.zip (69.66 KiB) downloaded 366 time(s).
code committed
- New Posts
- No New Posts