approximate - approximate a number series - Messages
I have a problem when using it. And I'm not very good at math.
I need to with the sum of three normal distributions.
I have determined the approximating function of 9 parameters, but the iteration of the parameter values to find the minimum of the smallest sum of squares does not go. The program writes that my expression is set incorrectly.
Meaning - Sq(h1,h2, h3, µ1,µ2,µ3,σ1,σ2,σ3)
Could you tell me what I did wrong?
Solution file (01.sm) I attach - 01.sm (31.57 KiB) downloaded 944 time(s)..
P.S. I'm sorry, I don't speak English very well
1.) In the function definition of Sq() I used the vectorize function on the Raz()^2. This performs element-wise operations on x, y rather than matrix operations.
2.) In your programming loop. I assigned Sq:=Sq() then changed the conditional to Sq < Sqmin. This was because later you have Sqmin:=Sq, but never defined the value Sq.
01.sm (31.65 KiB) downloaded 989 time(s).
What's it?
Frechet Forum.sm?
You weren't answering my question, you were answering someone else's.
WroteColleagues.
I have a problem when using it. And I'm not very good at math.
I need to with the sum of three normal distributions.
I have determined the approximating function of 9 parameters, but the iteration of the parameter values to find the minimum of the smallest sum of squares does not go. The program writes that my expression is set incorrectly.
Meaning - Sq(h1,h2, h3, µ1,µ2,µ3,σ1,σ2,σ3)
Could you tell me what I did wrong?
Solution file (01.sm) I attach - 01.sm (31.57 KiB) downloaded 944 time(s)..
P.S. I'm sorry, I don't speak English very well
I guess you are trying to multiply matrix elements with itselfs by squaring it.
You can't do that mathematically, unless you vectorize it.

Here is your revised file.
Regards
01_rev.sm (30.82 KiB) downloaded 990 time(s).
Thank you for correcting my mistake.
But the desired result still did not work.
There, for some reason, the search of options stopped at the value of hh1 = 0.01, respectively, and hh2 = 001, hh3 = 0.01. That is, h1, h2, and h3 were only checked when the value =1.
Whereas I expected that the iteration of options should reach hh1 = hh2 = hh3 = 1, respectively h1 = h2 = h3 = 100.
For other parameters, it also seems that the search for options has not reached the end.
That is why the resulting graph shows a complete mismatch between the original data and the approximating formula.
I don't have an error in the If statement?
There I put continue in the else field.
eng-min.sm (32.5 KiB) downloaded 944 time(s).
I was trying to sum the squares of the error difference.
See the eng-min file in the last replica.
WroteThank you, I have already been pointed out to this error.
I was trying to sum the squares of the error difference.
See the eng-min file in the last replica.
Your iterations are ill and wrong if this is not intended. Let me explain.
When sigma.3 reach 150, sigma.2 becomes 2. But sigma.3 doesn't start from 1 after it.
It has to be reseted to 1 but not on your algorithm.
Using a for loop is much more sense here.
But beware, when all ranges multiplied we reach 1.35×10¹⁹.
This means your algorithm is trying to calculate 1.35×10¹⁹ times.
Even 1×10⁶ takes 30 second on my pc. That algorithm will take very long.
I think we can't see the result of your problem in a human life time.
You can find worksheet below.
Regards.
eng-min_rev.sm (30.78 KiB) downloaded 975 time(s).
eng-min.sm (44.48 KiB) downloaded 967 time(s).
eng-min.pdf (382.41 KiB) downloaded 651 time(s).
Best regards.
Alvaro.
Thanks.
This subtlety that sigma does not reset, I did not understand, but the result began to assume something similar.
I'll look at your edits carefully.
Your math is too complicated for me, and I'm not very good with matrices and vectors, but I'll try to figure it out.
You certainly offer an approximation, but unfortunately not the one I need.
Thanks.
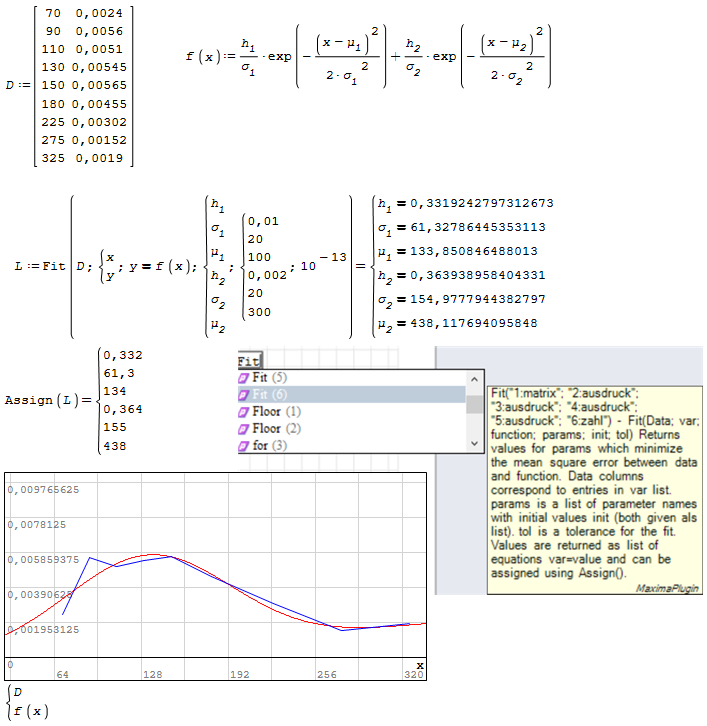
I decided to take a simpler case for now, when we approximate the sum of two distributions.
With some tweaks, the time limit can be circumvented. Although I haven't tried the Fit function yet. Perhaps it will give you a gain in time.
Can you tell me how to limit the accuracy of the calculations? There Sq is calculated with an accuracy of 15 decimal places, while 9 digits are quite enough for me. This would give you a gain in time.
The approximation is quite satisfactory. The defined integral differs from the original value by only 1.5%. Given that the raw data is quite rough, there is actually a histogram, this is quite acceptable.
But I still need to calculate the Pearson correlation coefficient, and I'm faced with the fact that the reference book does not specify how to find the sum of the elements of any vector. Can you tell me what you can do in this case?
Pirson-0.sm (14.55 KiB) downloaded 996 time(s).
Regards.
WroteBut I still need to calculate the Pearson correlation coefficient, and I'm faced with the fact that the reference book does not specify how to find the sum of the elements of any vector. Can you tell me what you can do in this case?
Regards.
Below you can find how to calculate Pearson correlation coefficient.
To sum all elements of a vector, you can use sum(1).
To operate piecewise you can use sum(4).
You can also use for-loop and while() to calculate something in a vector/matrix. Not demonstrated here.
Regards
pearson.sm (8.9 KiB) downloaded 993 time(s).

Thank you very much.
All problems, as I see, are solved.
How to use the loop for calculations (for loop and while), I, in general, imagined, but I did not guess to look in the sum functions.
The fact is that I use a non-English version, and the help in it does not work very well yet.
Thanks.
There is only one small problem left – is it possible to reduce the accuracy of calculating Sq, respectively Sqmin? As was seen in the calculations, they are calculated with an accuracy of up to 15 decimal places.
And this obviously affects the calculation time. Whereas 9 decimal places, maybe even 8 digits, would be enough for me.
As you rightly pointed out – the calculation time becomes huge.
But I now got out of the situation so that first I manually select an approximate solution (about 5-10 minutes). Then I set the iteration iteration step to 2 or 3 with a wide limit.
The calculation takes 40 minutes. After setting the iteration step to 1, simultaneously reducing the range of values. The calculation takes about 10 minutes.
Thus, the required accuracy is obtained – especially since the integration after the calculation confirms the accuracy of the calculation.
I'll also calculate the Pearson coefficient – in general, it will be fine, you can't ask for anything better. For one set of source data, it takes about 1 hour.
If we have to count three normal distributions instead of two, the time will increase, of course, but I think it will remain within reasonable limits.
Although, if it were possible to reduce the accuracy of the calculations, the calculation would become even easier.
Regards.
I tried to compose the solution as you suggested.
But for some reason, the program gives an error.
In addition, I have a question – you suggested a solution when the approximation is based on the sum of two normal distributions.
And in my source data, this does not always happen. It is often necessary to look for an approximation by the sum of the three distributions.
Will this increase the calculation time to inconvenient values?
Fit-1.sm (10.39 KiB) downloaded 940 time(s).
Regards.
Wrote
There are 3 Pearson coefficients.
From there, up you go.
Thanks
Your solution record is certainly more compact.
However, it will be more difficult for me to modify it for my other cases compared to the Overlord entry.
Regards.
WroteThere is only one small problem left – is it possible to reduce the accuracy of calculating Sq, respectively Sqmin?
I have an idea for it, for your original function. Don't know if it is applicable or I have the right idea or skills.
I will try to implement when I am available.
Regards
Wrote
I have an idea for it, for your original function. Don't know if it is applicable or I have the right idea or skills.
I will try to implement when I am available.
Regards
Thanks.
Here is the entire calculation from start to finish as it currently stands
Pirsonend.sm (36.09 KiB) downloaded 973 time(s).
Regards
Wrote
Problem is that we don't know what you are looking for.
Are you looking for the best fit to your data set ???
If so, minute job.
Please, don't hesitate ... Jean
So I wrote down what I needed at the very beginning.
There is a data set (two rows of numbers).
Basically, they should be random sets.
However, in reality, two or even three different data sets are mixed there.
I need to separate them - to identify those normal distributions that correspond to pure data sets (not mixed data sets).
In the previous replica of for overlord, I posted the full calculation method.
Now only one question remains. Iterating through 9 parameters requires a lot of time. And the calculation is carried out with an accuracy that is superfluous for my purposes.
Sq and Sqmin are calculated with an accuracy of 15 decimal places. And I would have more than enough 8 or 9 digits after the decimal point.
This would significantly reduce the calculation time.
And here is the Pearson correlation coefficient I have 0.9999, whereas I would have more than enough 0.9
On the other hand, perhaps the Pearson coefficient should not be worsened.
Here in that calculation (in the previous replica) I had an error after integrating 1.5%, and I slightly knocked down the parameters, and it increased to 2.4%.
And this is more important than the Pearson coefficient. I would not count it at all, but I will definitely be asked a question about this coefficient.
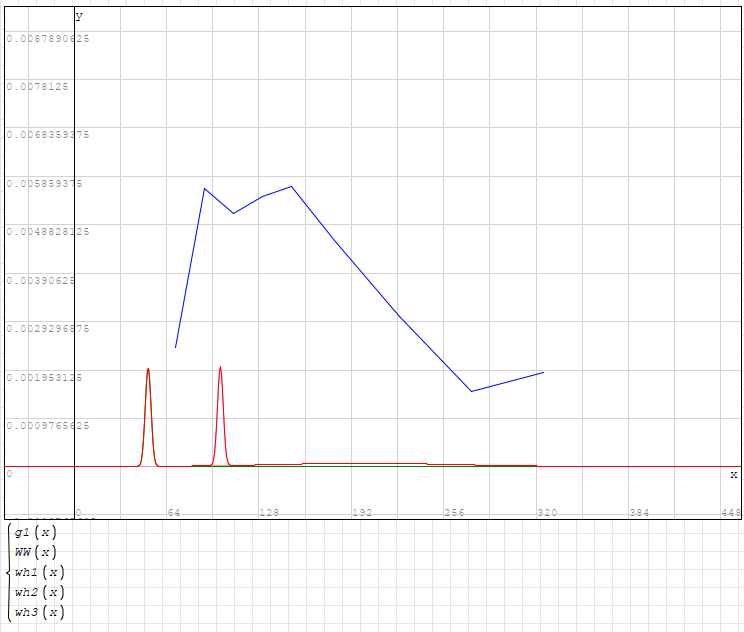
There the definite integral is taken WW(x). And it is equal to 0.9658.
And initially I have a histogram g2(x), and if you take the integral of it, it will be equal to 0.99.
And in my case, this is more important than the Pearson coefficient.
- New Posts
- No New Posts