DISLIN - A high-level plotting library for displaying data - Messages
Best regards
Franco

In my notebook I've not unlocked the privileges for "C:\" so the file crashes, but using another path where I have the privileges you have to use simply that path (standard, without double backslashes).
![2016-02-25 16_35_45-SMath Studio Desktop - [DISLIN.%20Example1.sm_].png](/en-US/files/Download/mZk6Nr/2016-02-25-16_35_45-SMath-Studio-Desktop---[DISLIN.%20Example1.sm_].png)
![2016-02-25 16_35_55-SMath Studio Desktop - [DISLIN.%20Example1.sm_].png](/en-US/files/Download/Rh3Vgn/2016-02-25-16_35_55-SMath-Studio-Desktop---[DISLIN.%20Example1.sm_].png)
BTW I can't resize the image from the context menu of the Image region, an hard crash occours
![2016-02-25 16_36_07-SMath Studio Desktop - [DISLIN.%20Example1.sm_].png](/en-US/files/Download/4uouwb/2016-02-25-16_36_07-SMath-Studio-Desktop---[DISLIN.%20Example1.sm_].png)
![2016-02-25 16_36_31-SMath Studio Desktop - [DISLIN.%20Example1.sm_].png](/en-US/files/Download/zSrDR2/2016-02-25-16_36_31-SMath-Studio-Desktop---[DISLIN.%20Example1.sm_].png)
Wrote
BTW I can't resize the image from the context menu of the Image region, an hard crash occours
Please report any Image Region bugs to the plugin thread (together with offending file) - I will definitely investigate this.
I have quickly checked "reset size" on a variety of .svg (both embedded and linked) and they work well
I have tried to enter a normal path without succeeding probably I am a beginner and I am not able to enter a simple path in a placeholder too.
So not being able to do this I tried the brutal approach of the copy and paste of the path from the first DSLIN instruction and it is with a double quote ..and it worked fine ; probably it is a feature of the image plug-in that is undocumented.
Then I started to play with the image turning it and was OK than I probably played with the size handle and had your same issue .
To make other testing I was forced to reload the file from the UNI e-mail and restart from scratch.
Best regards
Franco

DISLIN. Example 2.pdf (235.04 KiB) downloaded 958 time(s).
DISLIN. Example 2.sm (122.79 KiB) downloaded 1703 time(s).
How to draw a 3d sphere:
DISLIN. Example 3.pdf (954.31 KiB) downloaded 989 time(s).
DISLIN. Example 3.sm (308.64 KiB) downloaded 1698 time(s).
If I understand something in there [quite Chinese to me],
eventually you will be able to plot the breather, is it ?
Will that be compatible Smath 5346 ?
Jean
Breather for UNI.sm (308.66 KiB) downloaded 1407 time(s).
DISLIN: looks as huge as Scilab. 757 specifications
that's a lot of pages compared to Mathcad menu driven.
In the attached, everything is "robust" for your matrix.
I have interest for DISLIN, but not so much, Why?
DISLIN plotting 3D surface/volume is the wrong approach.
The sole approach is the Mathcad Matrix [single matrix
or triplet CreateMesh] as you can rotate from user on-line
command and in supplement use the picture operator. The
"Matrix Mathcad Method" allows Fourier applications, mostly
image processing, spectral analysis. How many non convivial
steps of DISLIN are eliminated from the "Robust" attach.
We are in 2016 modern stuff rather than 1970 Fortran.
Plugins & Plugins doing what in maths make me S...
when Smath does not "fft" more than a 7 x 7 matrix
"result is above max allowed number" ...
Why not more usable maths with Smath primarily maths oriented,
and doing lot in Maple companionship.
Pure comment from desperate 5346 waiting for a stable updated.
Why not an OdeSolve wrapper [call it plugin].
Jean
Utilities Surface Plot ROBUST.sm (25.71 KiB) downloaded 1414 time(s).
Wrote
BTW I can't resize the image from the context menu of the Image region, an hard crash occours
Hi All,
I would love to make the Image Region handle DISLIN properly, however I was not able to come up with a fix myself.
From what I understood, the SVG engine (https://svg.codeplex.com/) has trouble reading Height/Width of the .svg produced by DISLIN. If any of you guys need the functionality enough to investigate and come up with a solution I would love to implement it in the code of the Image Region.
WroteHello Uni !
If I understand something in there [quite Chinese to me],
eventually you will be able to plot the breather, is it ?
Will that be compatible Smath 5346 ?
Yes, I think it possible but now not implemented.
Plotting a Shaded Surface Grid from a Parametric Function
DISLIN. Example 4.sm (86.15 KiB) downloaded 1655 time(s).
DISLIN. Example 4.pdf (233.03 KiB) downloaded 921 time(s).
DISLIN. Example 5.sm (119.81 KiB) downloaded 1715 time(s).
DISLIN. Example 5.pdf (430.99 KiB) downloaded 928 time(s).
DISLIN. Example 6.sm (202.78 KiB) downloaded 1615 time(s).
DISLIN. Example 6.pdf (657.16 KiB) downloaded 1087 time(s).
WroteThanks! More than nice!
Very nice if you know no better. So many pages long before
collapse/open/collapse/open ... That function plots in
less that 10 seconds in Mathcad 11 and earlier, and you can
copy to clipboard, have it on any background color and instant
contour ++++ no sweat.
Jean
Best regards
Franco
WroteHi All,
I would love to make the Image Region handle DISLIN properly, however I was not able to come up with a fix myself.
From what I understood, the SVG engine (https://svg.codeplex.com/) has trouble reading Height/Width of the .svg produced by DISLIN. If any of you guys need the functionality enough to investigate and come up with a solution I would love to implement it in the code of the Image Region.
The svg file doesn't contain viewBox attribute. The ImageRegion plugin could check its availability and if it is not, then add your own:
<svg width="100%" height="100%" viewBox="0 0 800 800" xmlns="http://www.w3.org/2000/svg">WroteWroteHi All,
I would love to make the Image Region handle DISLIN properly, however I was not able to come up with a fix myself.
From what I understood, the SVG engine (https://svg.codeplex.com/) has trouble reading Height/Width of the .svg produced by DISLIN. If any of you guys need the functionality enough to investigate and come up with a solution I would love to implement it in the code of the Image Region.
The svg file doesn't contain viewBox attribute. The ImageRegion plugin could check its availability and if it is not, then add your own:<svg width="100%" height="100%" viewBox="0 0 800 800" xmlns="http://www.w3.org/2000/svg">[/code][/quote] After many-many attempts (I have literally spent good 6 hours to fix display of DISLIN svg) I have found the "correct" way of fixing the missing viewport parameter. Plugin was updated. [code=csharp] if (SVGdoc.OwnerDocument.ViewBox.Width == 0 || SVGdoc.OwnerDocument.ViewBox.Height == 0) { SVGdoc.Height = 1; SVGdoc.Width = 1; SVGdoc.Height = SVGdoc.Height.ToPercentage(); SVGdoc.Width = SVGdoc.Width.ToPercentage(); SVGdoc.OwnerDocument.ViewBox = new SvgViewBox(SVGdoc.OwnerDocument.Bounds.Left, SVGdoc.OwnerDocument.Bounds.Top, Convert.ToInt32(SVGdoc.OwnerDocument.GetDimensions().Width), Convert.ToInt32(SVGdoc.OwnerDocument.GetDimensions().Height)); SVGdoc.Height = Convert.ToInt32(SVGdoc.OwnerDocument.GetDimensions().Height); SVGdoc.Width = Convert.ToInt32(SVGdoc.OwnerDocument.GetDimensions().Width); }
Seems like an extremely simple piece of code now... Doesn't it always.
WroteAfter many-many attempts (I have literally spent good 6 hours to fix display of DISLIN svg) I have found the "correct" way of fixing the missing viewport parameter.
Plugin was updated.
Yes, it works. Welcome aboard.
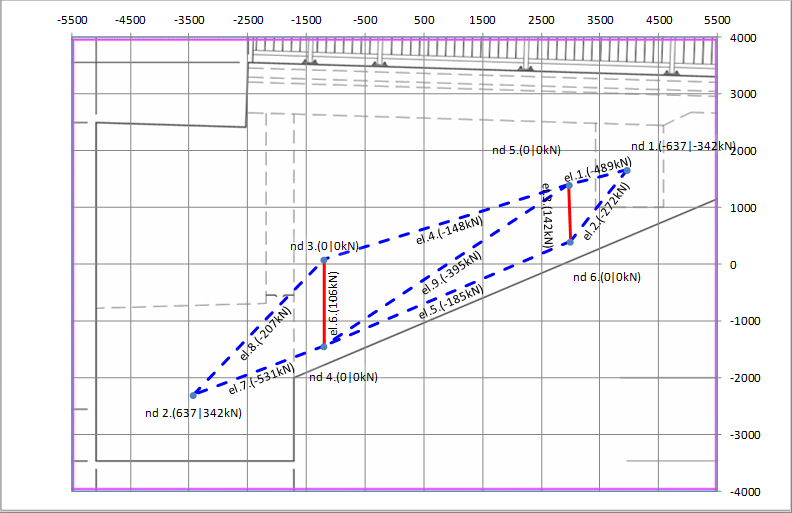
What is the most encompassing example do you guys have on using DISLIN for 2D plots?
I need to plot a set of straight lines and single points (up to a 100 or so, each is a separate dataset) and am looking for:
- setting the color of each single line
- setting the line type / weight of each single line
- adding a label to each single line
- adding a label to each single point
- precisely manipulating the height / width / position of plot area (independently of the size of the resulting SVG
- adding legend
- adding grid lines
I am aware that a few of the points above are covered by sine/cosine plot from earlier... I am just looking for the most all-encompassing example you guys have.
Thanks!
Jean
I start getting pregnant.
Somewhat long coding before the bird flies out of the nest.
Salut Ioan and all Collabs
" Le petit pain est dans le four " [bread is cooking]
It is foreseeable that at some point the plugin might become more user friendly, with many settings handled by its own, stand alone, region.. if the end result is worth the effort.
- New Posts
- No New Posts