1 Pages (13 items)
chart with 3 axis Y - Messages
#1 Posted: 5/6/2022 7:51:10 AM
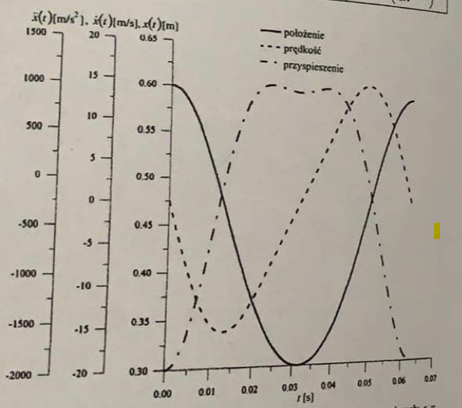
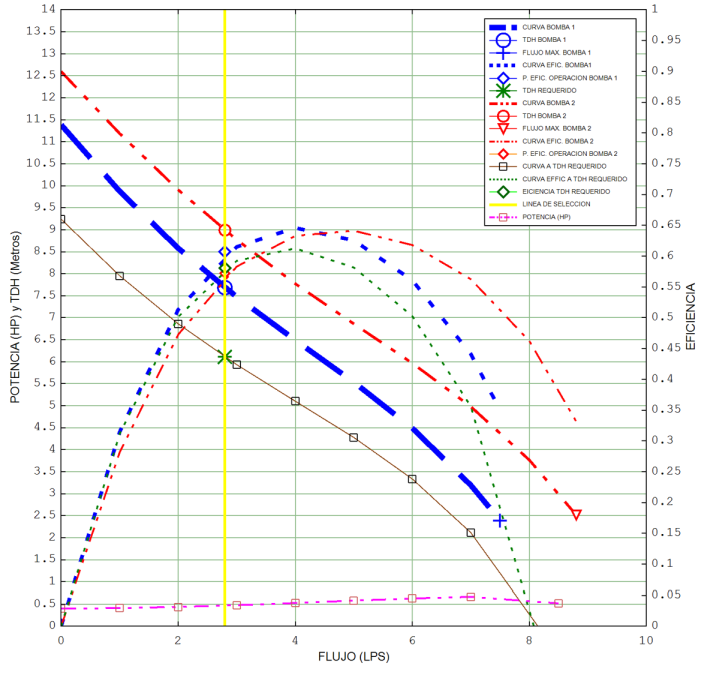
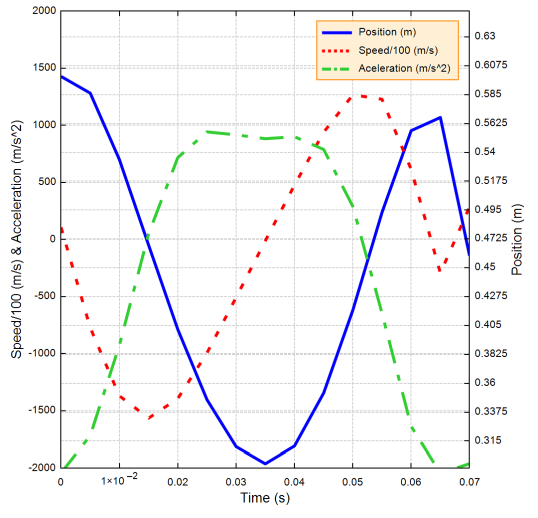
Is it possible to make such a chart with three Y axes on a single chart?
something like this
https://ibb.co/JcRn2B9
something like this
https://ibb.co/JcRn2B9
#2 Posted: 5/6/2022 8:01:53 AM
In case you want to have more than one Y value axis, in"XY Plugin" you can set two different Y axis scales: some traces will refer to Y1, some to Y2
I think that there is not "out of the box" tool to have three or more Y axis.
I think that there is not "out of the box" tool to have three or more Y axis.
#3 Posted: 5/6/2022 8:19:07 AM
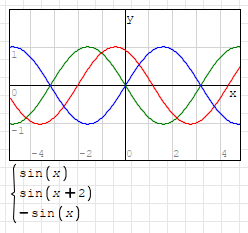
It is not possible to show three separate y-axis as fedeghi already told.
However, you can show three function on a single chart with sys().
Regards
However, you can show three function on a single chart with sys().
Regards
#4 Posted: 5/6/2022 10:41:27 AM
WroteIs it possible to make such a chart with three Y axes on a single chart?
You can have as many as you want of fake style like the image.
Create Y's as image and slide close to the plot.
You can do lot more Professional ... associate each graph with Nodes Labels.
Cheers ... Jean.
#5 Posted: 5/6/2022 11:05:05 AM

WroteIs it possible to make such a chart with three Y axes on a single chart?
Using X-Y Plot Region, you can simulate your graph with any number of axes, but needs some programming like in this example.
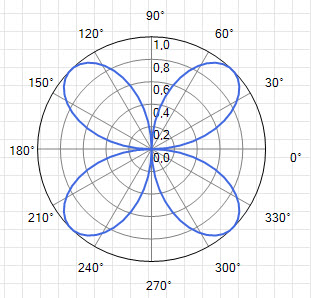
XYPlot. Linear polar.sm (61.18 KiB) downloaded 1034 time(s).
Russia ☭ forever, Viacheslav N. Mezentsev
#6 Posted: 5/6/2022 12:04:31 PM
Hi. Also, you can do that in Plotly:
https://plotly.com/chart-studio-help/excel/three-y-axes/
and then put it into SMath, but I don't know how to use the plugin, or if it is available:
https://en.smath.com/forum/yaf_postst17372_Plotly.aspx
Best regards.
Alvaro.
https://plotly.com/chart-studio-help/excel/three-y-axes/
and then put it into SMath, but I don't know how to use the plugin, or if it is available:
https://en.smath.com/forum/yaf_postst17372_Plotly.aspx
Best regards.
Alvaro.
#7 Posted: 5/6/2022 12:19:50 PM
... omitted details:
1. X_Y does not accept Nodes Labels.
2. X_Y splines nicely data set, QuickPlot NOT
3. Both X_Y, QuickPlot accept 3D isometric axes.
1. X_Y does not accept Nodes Labels.
2. X_Y splines nicely data set, QuickPlot NOT
3. Both X_Y, QuickPlot accept 3D isometric axes.
#8 Posted: 5/6/2022 4:02:34 PM
It is possible to use a graph with 2 Y-axes as shown in the image.
Best Regards
Carlos
Best Regards
Carlos
#9 Posted: 5/8/2022 5:37:38 PM
WroteYou can have as many as you want of fake style like the image.
Create Y's as image and slide close to the plot.
You can do lot more Professional ... associate each graph with Nodes Labels.
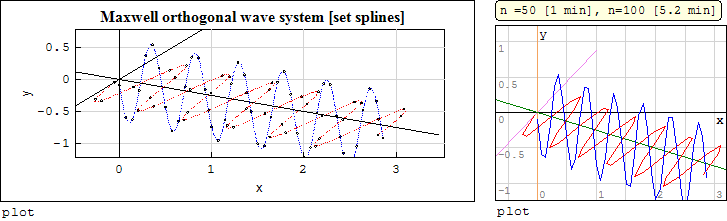
... as many as you want horizontal/vertical,
disposed inner wrt the Quick Plot
otherwise outside X_Y past build-in default 2.
Utilities XY Label Graph MORE.sm (35.86 KiB) downloaded 1056 time(s).
#10 Posted: 5/9/2022 8:18:23 AM
WroteYou can have as many as you want of fake style
... from this factory demo.
Utilities XY Label Graph Y.sm (22.32 KiB) downloaded 990 time(s).
#11 Posted: 5/9/2022 10:21:01 AM
... for whatever end use, add margins/calipers.
Utilities XY Label Graph Y factory.sm (41.03 KiB) downloaded 1059 time(s).
Utilities XY Label Graph Y factory.sm (41.03 KiB) downloaded 1059 time(s).
#12 Posted: 5/10/2022 2:05:02 PM
thanks for helping everyone. I used plotly and coped with the charts.
#13 Posted: 5/10/2022 11:48:21 PM
Hello
I think your graph could be like this
Three_exes_Graf.sm (32.97 KiB) downloaded 1041 time(s).
Best Regards
Carlos
I think your graph could be like this
Three_exes_Graf.sm (32.97 KiB) downloaded 1041 time(s).
Best Regards
Carlos
1 Pages (13 items)
- New Posts
- No New Posts