Phasor - Messages
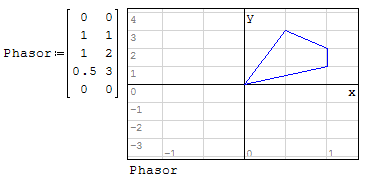
I need to draw phasors (lines-vectors) for AC circuit analysis.
- Line from origin to a point.
- Line from a point to another
The magnitude and the angle or Real and Imaginary parts are known.
Is there any related example?
Thank you,
Basile
WroteHello,
I need to draw phasors (lines-vectors) for AC circuit analysis.
- Line from origin to a point.
- Line from a point to another
The magnitude and the angle or Real and Imaginary parts are known.
Is there any related example?
Brute force quick
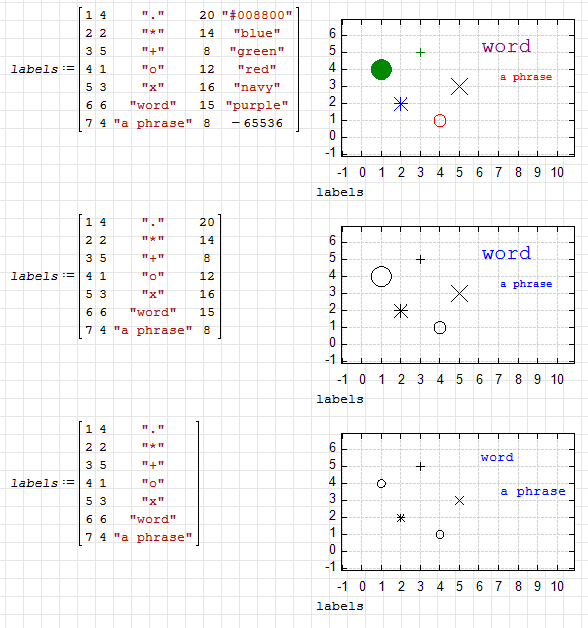
Any way to use different colour for some segments?
Put an arrow or a circle at the end?
Have a text to identify each segment?
Basile

XYPlot. Draw shapes.sm (19.85 KiB) downloaded 2841 time(s).
XYPlot. Draw shapes.pdf (92.91 KiB) downloaded 1918 time(s).
WroteThank you Jean.
Any way to use different colour for some segments?
Put an arrow or a circle at the end?
Have a text to identify each segment?
Basile
Hello Basile,
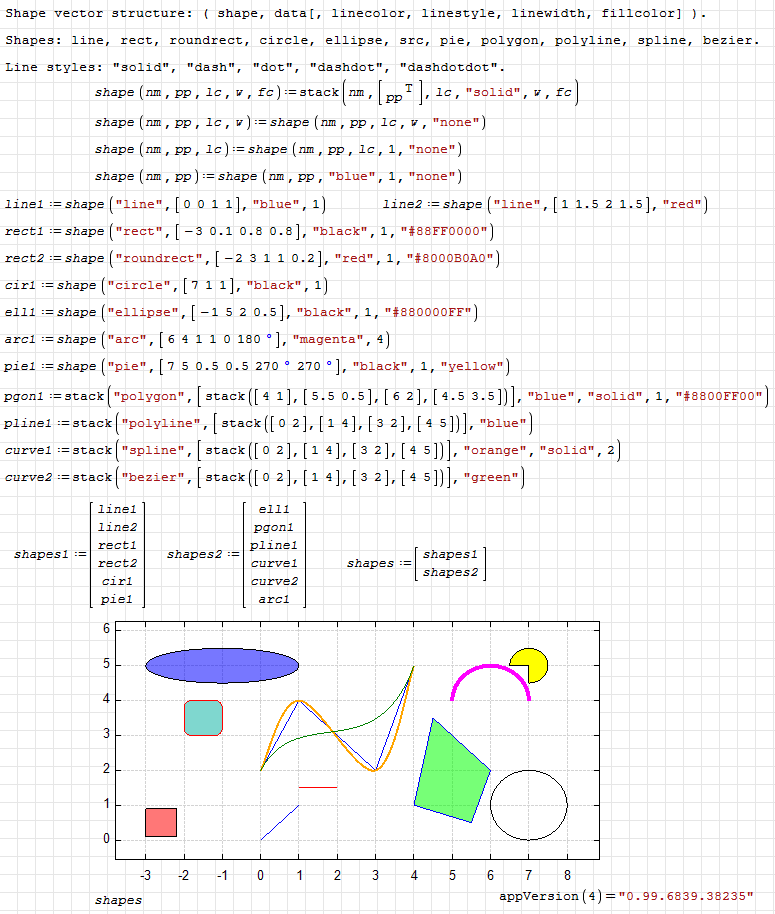
You should be able to build your circuit with the attached.
Make something, attach and we will add text if you can't.
Cheers ... Jean
Circle_rkfixed Arrow.sm (27.63 KiB) downloaded 1006 time(s).
2D Util Bar Arrow Model.sm (22.97 KiB) downloaded 994 time(s).
Circle_rkfixed Clock.sm (23.28 KiB) downloaded 1021 time(s).
WroteThank you Jean.
Any way to use different colour for some segments?
Put an arrow or a circle at the end?
Have a text to identify each segment?
Basile
Hello, Basile
On that one you can do a bit more.
Too much may be too much, isn't ?
Cheers ... Jean
Maths Polygon.sm (17.1 KiB) downloaded 1016 time(s).
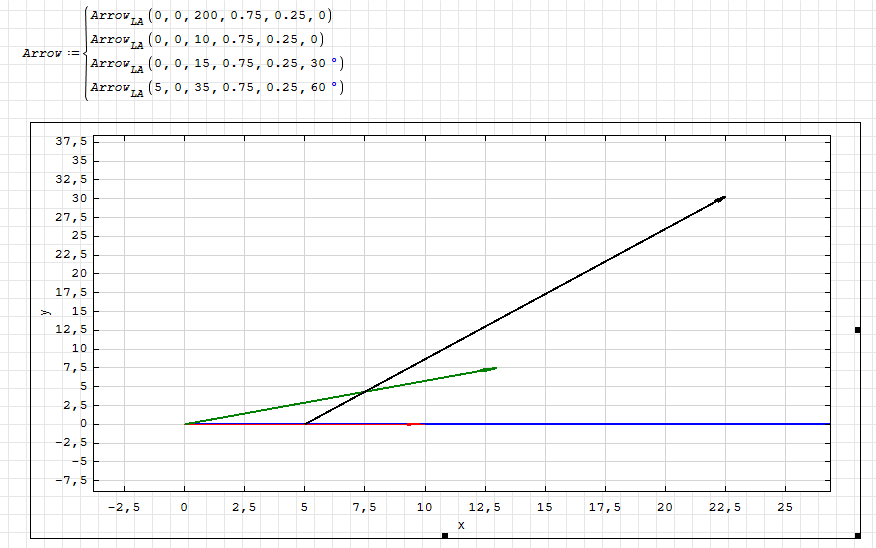
Why the Lv is not defined?
I express the matrices as function.
And then the vectors evaluate!
What are the red squares to the right?
It looks that this approach of drawing vectors is a begging.
I shall work on it.
Thank you,
BasilePage2-error.sm (12.71 KiB) downloaded 1106 time(s).
WroteWhat are the red squares to the right?
Red square in the scroll bar points at the errors in the document.
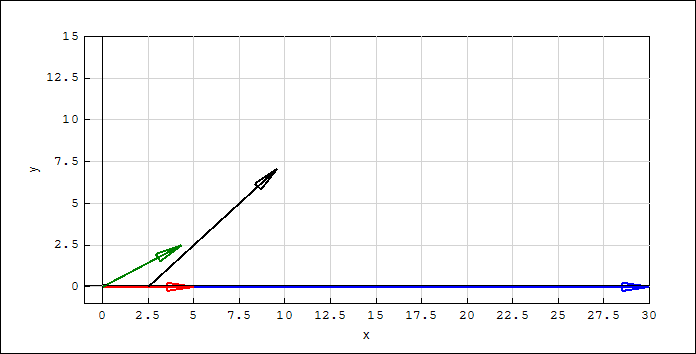
More elegant arrows proposed.
Page2-error.sm (8.34 KiB) downloaded 1149 time(s).
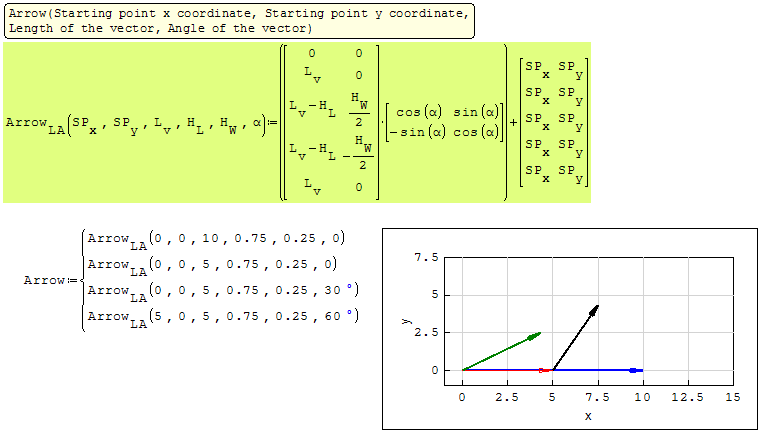
The arrows fail when the length of the vector changes.
I have tried as a percentage of length but does not look nice.
Scaling the vectors to always be one but will loose real values
 .
.Any good idea?
Is there a way to auto-scale the 2D plot or X-Y plot?
One of the vectors is out of the visual plane.
Thanks,
Basile
WroteHow about a simple arrow?
WroteI do not know how to do it better. The arrow should look good in different scales and in its own size.
WroteAny good idea?
Is there a way to auto-scale the 2D plot or X-Y plot?
One of the vectors is out of the visual plane.
None of the quick plot or X_Y plot can be made X, Y directions scalable
similar to Mathcad 11 ... to me: useless.
From an original X_Y plot creation, stretch by handles respect aspect ratio.
If you modify the X, Y directions [max/min], apply close enough HL, HW ratio.
Page2-error (1).sm (11.66 KiB) downloaded 1159 time(s).


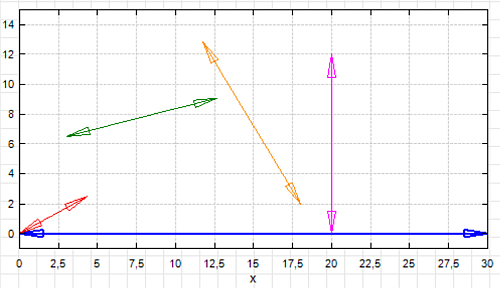
Wrote
More elegant arrows proposed.
With both arrow heads, based on Jean's method.
Thank you Jean.
Both Arrows.sm (30.49 KiB) downloaded 977 time(s).
Why I am getting errors when load your file?
The latest Stable: SMath Studio 0.99.7030 (01 April 2019)
File not found.File not found.
At the end I am able to open the file.
I do the same with two arrows 2π apart, but yours is more elegant.
Basile
- New Posts
- No New Posts