X-Y Plot Region - Extends SMath Studio with a X-Y Plot Region. - Сообщения
WroteHello Martin,
I had mistakenly understood that the problem is on the plot ' geometries '
It was working fine
now trying on "spannungen" plot, I have the same problem
I apologize
Sergio
That was not mistakenly. In fact I can reproduce the problem with my uploaded file on both plots. And I can confirm that Radovans version works fine here. Unless I hide the input area and save and re-open the file. Saving the file with visible input regions seems to be safe.
Technische Mechanik mit SMath Studio: https://link.springer.com/book/10.1007/978-3-658-50592-9
1 пользователям понравился этот пост
Radovan Omorjan 26.05.2013 07:51:00

Andrey said that will fix this in the next version.
Russia ☭ forever, Viacheslav N. Mezentsev

325 сообщений из 2 052 понравились и 1 не понравились пользователям.
Группа: Moderator
WroteAndrey said that will fix this in the next version.
I think there is nothing wrong if we forget and repeat the things
 . As I become older the frequency of my forgetting things is increasing
By the way, what about introducing some kind of "bugzilla" thing in order to keep tracking of bugs? I am not sure about it, and it seems that this Forum is still good enough for this.
Regards,
Radovan
When Sisyphus climbed to the top of a hill, they said: "Wrong boulder!"
1 пользователям понравился этот пост
ioan92 26.05.2013 09:26:00
Just wanted to congratulate omorr with 100 thanks Note this number - it will surely soon be not so round!
Note this number - it will surely soon be not so round!С уважением,
Михаил Каганский
1 пользователям понравился этот пост
Radovan Omorjan 26.05.2013 10:56:00
This issue related not only for X-Y Plot but for all regions which have placeholder. I would like to clarify that people are not confused.
Russia ☭ forever, Viacheslav N. Mezentsev
1 пользователям понравился этот пост
Radovan Omorjan 26.05.2013 10:54:00
Russia ☭ forever, Viacheslav N. Mezentsev
1 пользователям понравился этот пост
Martin Kraska 01.06.2013 14:33:00
325 сообщений из 2 052 понравились и 1 не понравились пользователям.
Группа: Moderator
Wrote
Nice trick uni , thank you

It could have been done with bar graphs as well. I think there is no this type of graph implemented yet, neither in X-Yplot nor ZedGraph.
Regards,
Radovan
When Sisyphus climbed to the top of a hill, they said: "Wrong boulder!"
1 пользователям понравился этот пост
Davide Carpi 01.06.2013 05:26:00
Technische Mechanik mit SMath Studio: https://link.springer.com/book/10.1007/978-3-658-50592-9
3 пользователям понравился этот пост

WroteSlightly off-topic, as no xy-plot involved...
I think could be posted as a snippet, very nice stuff

If you like my plugins please consider to support the program buying a license; for personal contributions to me: paypal.me/dcprojects
1 пользователям понравился этот пост
Fridel Selitsky 21.09.2013 02:54:00
@Uni
This .Net2.0 LGPL library could be useful for your plugin.
Johns Hope's FPlot
The download includes the program as well as the library.
It permorms plotting and fitting of measurement data and mathematical functions (Levenberg-Marquardt and Nelder & Mead fitting).
It has nice interactive features (zoom and trace) and an interesting user interface.
3 пользователям понравился этот пост
Radovan Omorjan 03.06.2013 07:24:00, ioan92 03.06.2013 13:50:00, Вячеслав Мезенцев 03.06.2013 07:53:00
Version 4906.20018 of XYPlot fails to install on my system (portable 4902). Error message says: plugin deactivated. Unable to load one or more of the requested types. Retrieve the LoaderExceptions property for more information.
How can I do that?
How can I do that?
Technische Mechanik mit SMath Studio: https://link.springer.com/book/10.1007/978-3-658-50592-9
2 пользователям понравился этот пост
Updated. Added support for scripts (for testing).
chart2D.C2Points = `::Points`
chart2D.C2XAxis.XLimMin = `::x.min`
chart2D.C2XAxis.XLimMax = `::x.max`
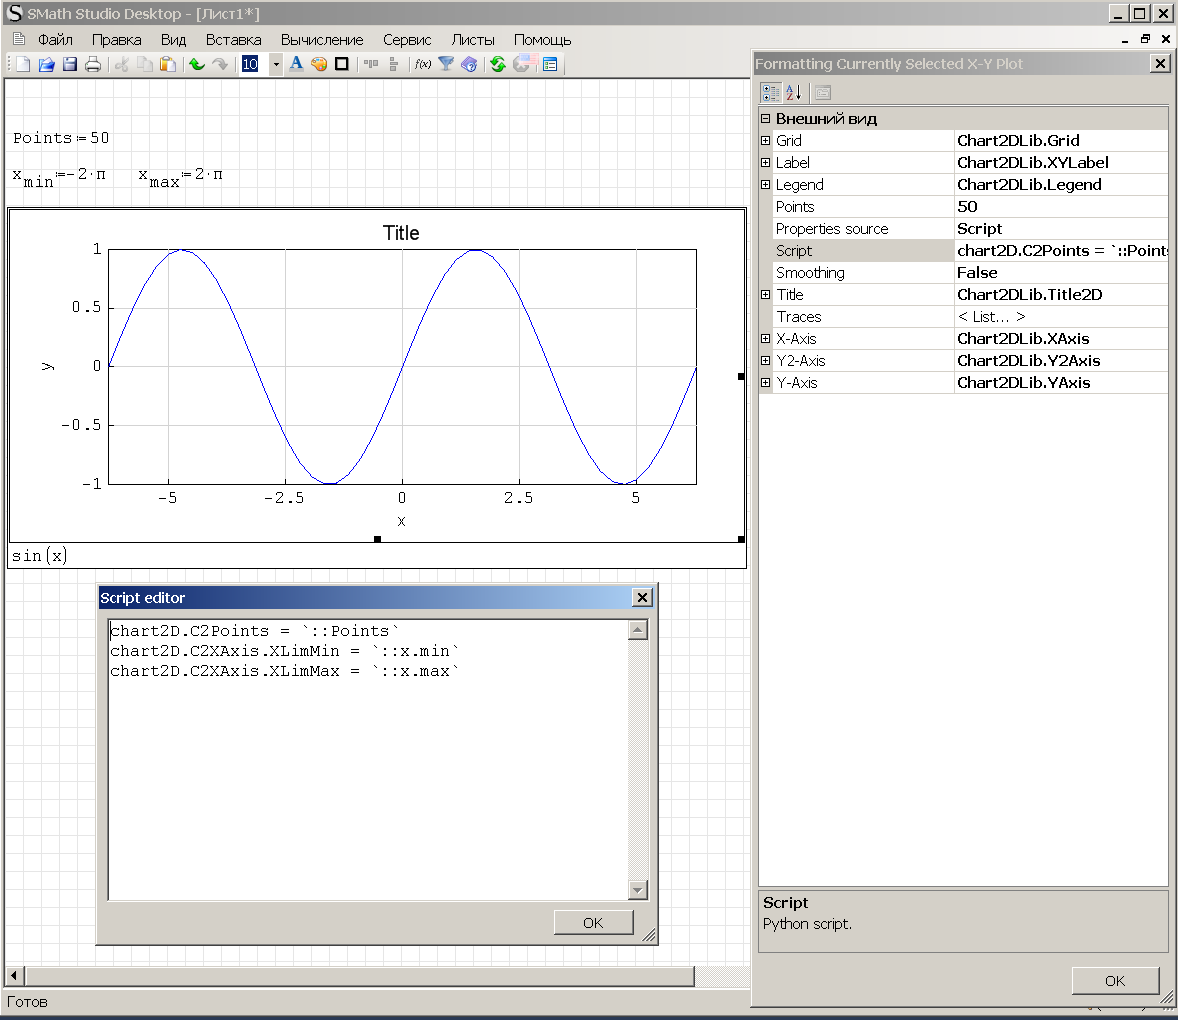
chart2D.C2Points = `::Points`
chart2D.C2XAxis.XLimMin = `::x.min`
chart2D.C2XAxis.XLimMax = `::x.max`
Russia ☭ forever, Viacheslav N. Mezentsev
1 пользователям понравился этот пост
IVR 12.06.2013 10:41:00
I use Iron Python. But the use of SciPy or NumPy is still a difficult task.
Russia ☭ forever, Viacheslav N. Mezentsev
Nice! ironclad for NumPy might be of help though it is only for 32bit platforms for now.
http://new.scipy.org/faq.html#does-numpy-scipy-work-with-ironpython-net
I had thought about the possibility of Jython and then port jar to dll with IKVM but seems it was too utopical and simply does not work.
This brings me to the lushful idea about porting Jasymca with IKVM or following these Microsoft guidelines.
http://msdn.microsoft.com/en-us/library/c6t6bsdk%28VS.80%29.aspx

Hi
I'm trying to build your plugin XYPlotRegion with monodevelop 4.0 on ubuntu 13.04 and SMathStudio 0.96.4909
PluginRegion.cs:
public class PluginRegion : IPluginCustomRegion {
PluginRegion.cs(18,18): Error CS0535: `XYPlotPlugin.PluginRegion' does not implement interface member `SMath.Control.IPluginCustomRegion.TagName.get' (CS0535) (XYPlotRegion)
I have the same error with 3DPlotRegion plugin
Do you know this error ? I'm not a specialist of C#.
Philippe DALET
FRANCE
Hi, Philippe!
Yes, I know what the problem is. I think the sources are out of date. Unfortunately, I can't update it now. But you can solve this problem by adding few lines of code (use the latest dlls from SMath Studio: canvas.dll, ioman.dll, NuLib.dll and SyLib.dll).
namespace XYPlotPlugin {
public class PluginRegion : IPluginCustomRegion {
#region Private fields
string tagName = "xyplot";
AssemblyInfo[] dependences;
MenuButton[] menuButtons;
DragAndDropFileType[] dragAndDropFileTypes;
#endregion
#region Члены IPluginCustomRegion
public string TagName {
get { return tagName; }
}
Russia ☭ forever, Viacheslav N. Mezentsev
Thanks a lot.
That seems working on Ubuntu 12.04.
http://sourceforge.net/projects/pcpu/files/SmathStudio/smathstudio_0.96.4909_i386.deb/download
Philippe
That seems working on Ubuntu 12.04.
http://sourceforge.net/projects/pcpu/files/SmathStudio/smathstudio_0.96.4909_i386.deb/download
Philippe
WroteWroteSlightly off-topic, as no xy-plot involved...
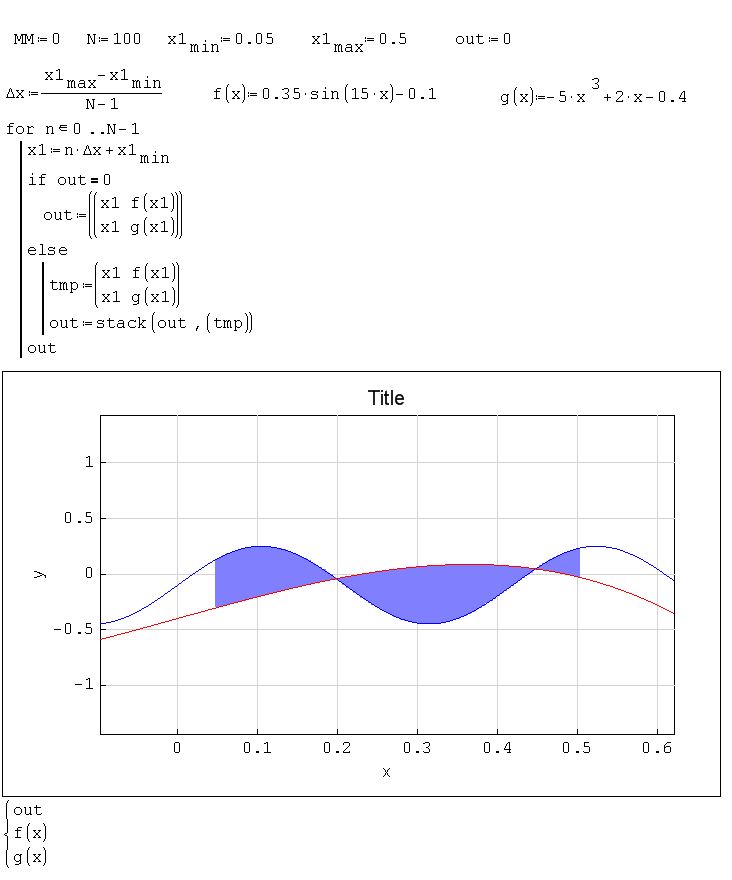
To reduce the computation time of function fil2 can change the first line of the program
hatch.sm (11,47 КиБ) скачан 1282 раз(а).
1 пользователям понравился этот пост
Martin Kraska 21.09.2013 05:02:00
Fridel, thanks for revisiting the snippet and the performance issue. Quite odd for me: The fastest way seems to be direct element adressing without pre-allocation and avoiding stack(). See attachment. The speed-up is significant.
Please post any response to the new dedicated topic
Snippet and examples are updated in the online gallery of the extension manager.
2DPlots with hatch and fill.sm (18,74 КиБ) скачан 1309 раз(а).
Please post any response to the new dedicated topic
Snippet and examples are updated in the online gallery of the extension manager.
2DPlots with hatch and fill.sm (18,74 КиБ) скачан 1309 раз(а).
Technische Mechanik mit SMath Studio: https://link.springer.com/book/10.1007/978-3-658-50592-9
1 пользователям понравился этот пост
Fridel Selitsky 21.09.2013 05:50:00
- Новые сообщения
- Нет новых сообщений