X-Y Plot Region - Extends SMath Studio with a X-Y Plot Region. - Сообщения
Thanks!

Griffith.sm (20,93 КиБ) скачан 1308 раз(а).
Workaround: Set the line color to transparent (see left plot).
Uni, I think that the X-Y Plot plugin is definitely worth further maintenance, as it currently provides the best trade between usability and flexibility. The Maxima plugin might provide similar capabilities some day (there are severe issues with list and matrix translations) but I do not expect the regular user to have Maxima installed or to learn the graphic objects and options.
Important improvements would be:
- log options for the axes
- format dialog similar to Mathcad (avoids clicking through the object tree).
- separate mouse scaling of x and y axes just like in the built-in plot region
VERGUET.txt (4,03 КиБ) скачан 1077 раз(а).
We still don't have an agreed version of code to save the plugin settings. In this regard, the new version of the plugin may be incompatible with old documents. The code that I use to save the settings I don't like. Need to alter it so that maintained upward compatibility. This problem hinders the development of the plugin.
EDIT: Try again. There were problems with redrawing.
EDIT2: Unfortunately, I can't now fully upgrade the plugin. I used the old sources for updates (I'm in another area). The current version of the plugin is not stable. Therefore, have to wait until I get back.
thanks a lot for your wonderful Estensions for SMath.
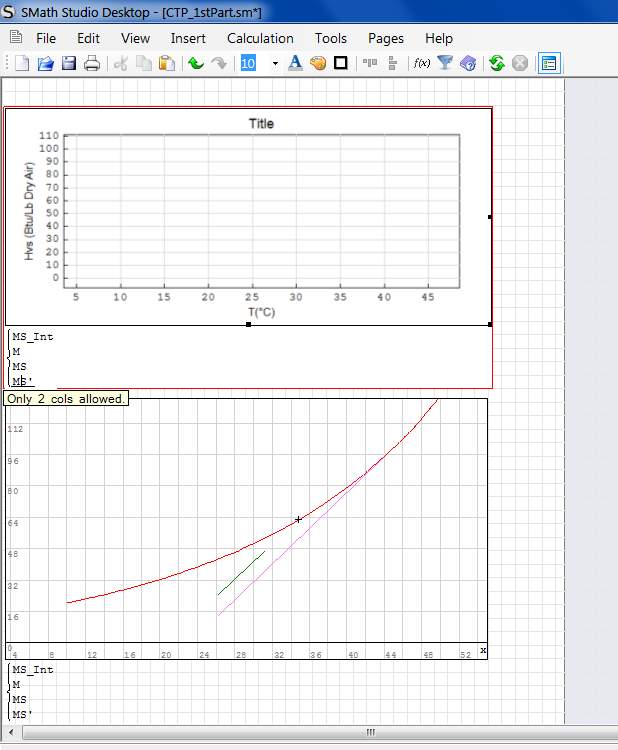
This message is just to inform you that there is a litte problem to draw single point in X-Y Plot despite 2D Plot.
Looks like are allowed only array with 2 colums ( see below ) and to draw single point are needed more.
Best Regard
Franco
I have checked better and have seen that with the X-Y Plot is possible to draw a single point not using the same method used for the Plot 2D Area.
So this need is addressed.
Best regards
Franco
Very strange.
Best Regards
Franco
Thank you very much for the nice plugin.
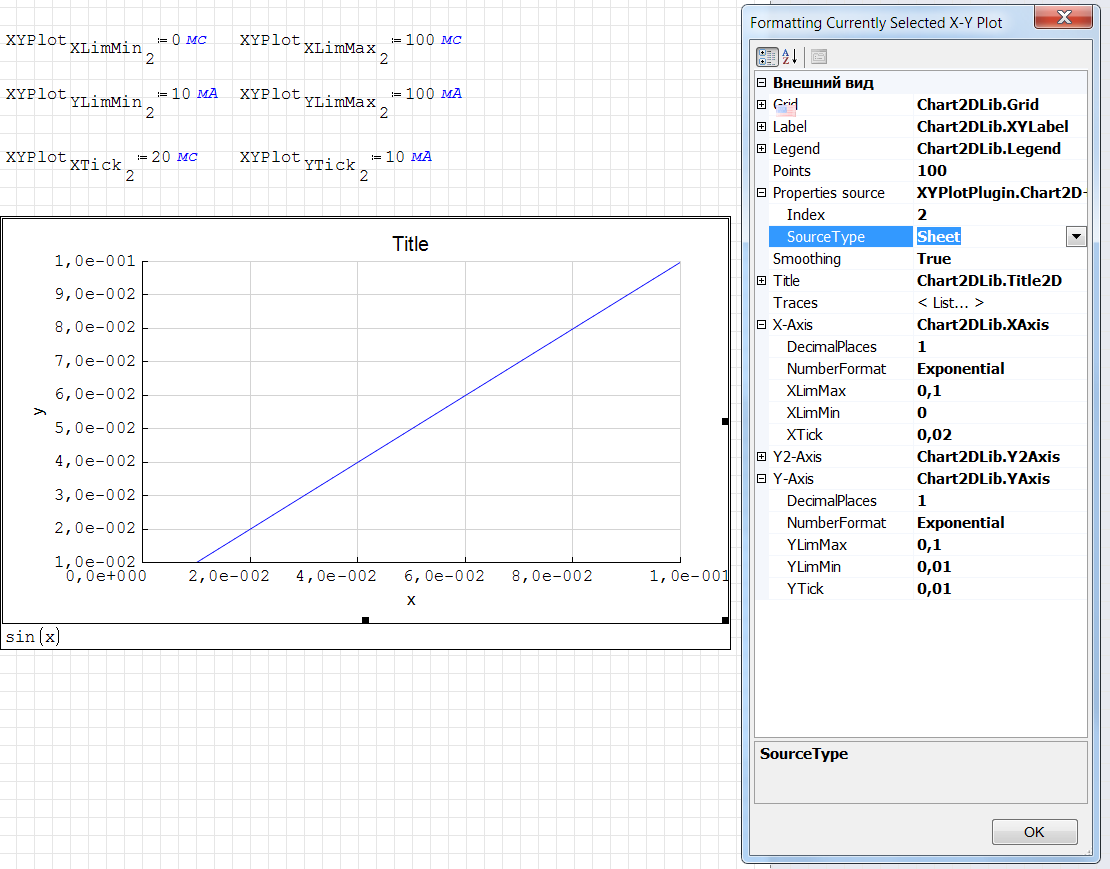
I would like to ask you whether there is a chance the limit of the axes (XLimMin, XLimMax, XTick, YLimMin, YlimMax and YTick) to be made to be updated from the worksheet of the Smath?
As example if I have a variable in the worksheet which to calculates my Xmin and Xmax limits to be able to enter the name of that variable in the fields for XLimMin and XLimMax.
Also it would be nice feature if it is possible, after some digits, the tick number to become with scientific notation. As example if I have a value between 10uA and 100uA and I want a tick in every 10uA, currently, X-Y plot will show it as 0.
Best Regards,
Adriyan
WroteHi Uni,
Thank you very much for the nice plugin.
I would like to ask you whether there is a chance the limit of the axes (XLimMin, XLimMax, XTick, YLimMin, YlimMax and YTick) to be made to be updated from the worksheet of the Smath?
As example if I have a variable in the worksheet which to calculates my Xmin and Xmax limits to be able to enter the name of that variable in the fields for XLimMin and XLimMax.
Also it would be nice feature if it is possible, after some digits, the tick number to become with scientific notation. As example if I have a value between 10uA and 100uA and I want a tick in every 10uA, currently, X-Y plot will show it as 0.
Best Regards,
Adriyan
Some of these things already exist but other need to be realized, I agree.
Thank you very much for the hints. Indeed, all which I require is already included in the package. My apologies that I have not seen all these features.
Once more thank you very much for the nice package and for the help.
Best Regards,
Adriyan
Thanks for your awesome plugin, it has helped me greatly with using SMath to visualize lots of data.

Is there currently a way to have a sheet control which can change the title and labels? Also is it possible to control the ticks and numbers on the Y2 axis? Currently it appears that using "XYPlot.Y2Tick" does not work.

I have noticed a strange behaviour in XY-Plot.
1. In a sm file there are 2 different plots (with index 1 & index 2) working as expected.
2. When the file is saved and reloaded, the 2nd plot re-adjusts to index 1, showing a distorted view.
Where have I gone wrong please? (sm file attached).
Regards
ndtma
Test XY Plot.sm (292,21 КиБ) скачан 1365 раз(а).
Is this a known bug? Which kind of further information do you need?
I too reported to this forum, about 5 months ago, about the problem of saving X-Y Plot settings.
WroteHi
I too reported to this forum, about 5 months ago, about the problem of saving X-Y Plot settings.
Updated. Fixed. Empty title now supported.
ЦитатаPlease, is there available the access by program to some other parameters as Traces colors and thinnesses ?
On the other side, I've seen that the plugin generate a system crash if wrong data. Please, could it be possible to include in the plugin a programming sequence of the type "ON ERROR GO NEXT" ?
I'll think about it. I must know what kind of wrong data you want to skip.
- Новые сообщения
- Нет новых сообщений