X-Y Plot Region - Extends SMath Studio with a X-Y Plot Region. - Сообщения

X-Y Plot Region


XYPlot. Examples.sm (30,04 КиБ) скачан 3458 раз(а).
XYPlot. Examples.pdf (154,55 КиБ) скачан 2699 раз(а).
XYPlot. Demo.sm (5,5 КиБ) скачан 2441 раз(а).
XYPlot. Demo.pdf (45,63 КиБ) скачан 1961 раз(а).
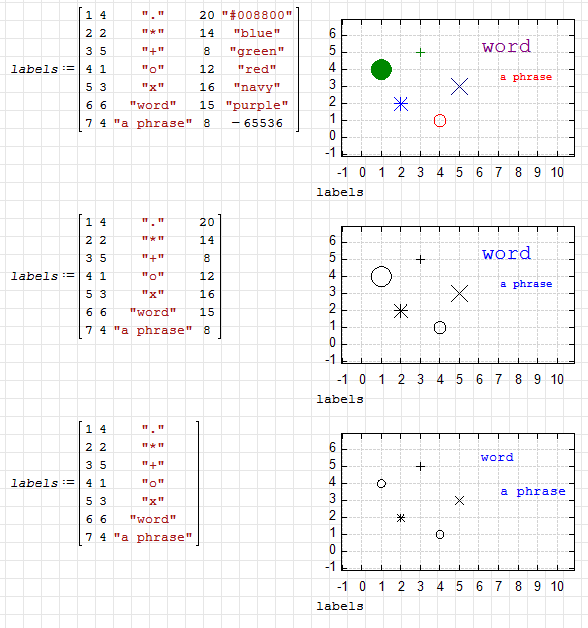
XYPlot. Text labels.sm (10,1 КиБ) скачан 2425 раз(а).
XYPlot. Text labels.pdf (53,78 КиБ) скачан 1610 раз(а).
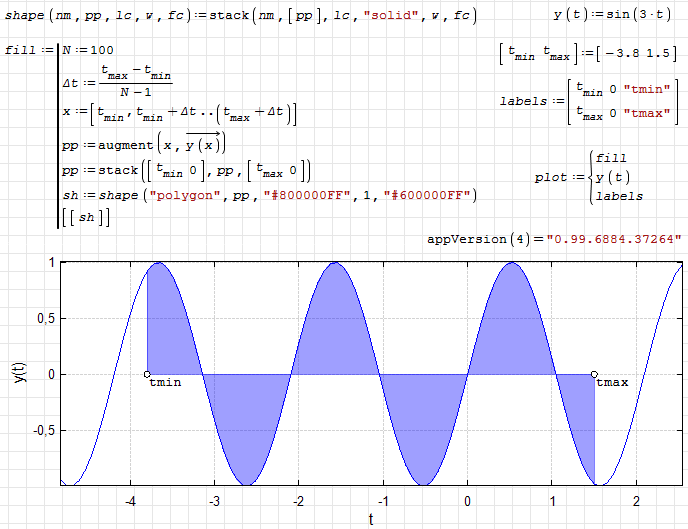
XYPlot. Fill area.sm (10,03 КиБ) скачан 2275 раз(а).
XYPlot. Fill area.pdf (84,35 КиБ) скачан 1423 раз(а).
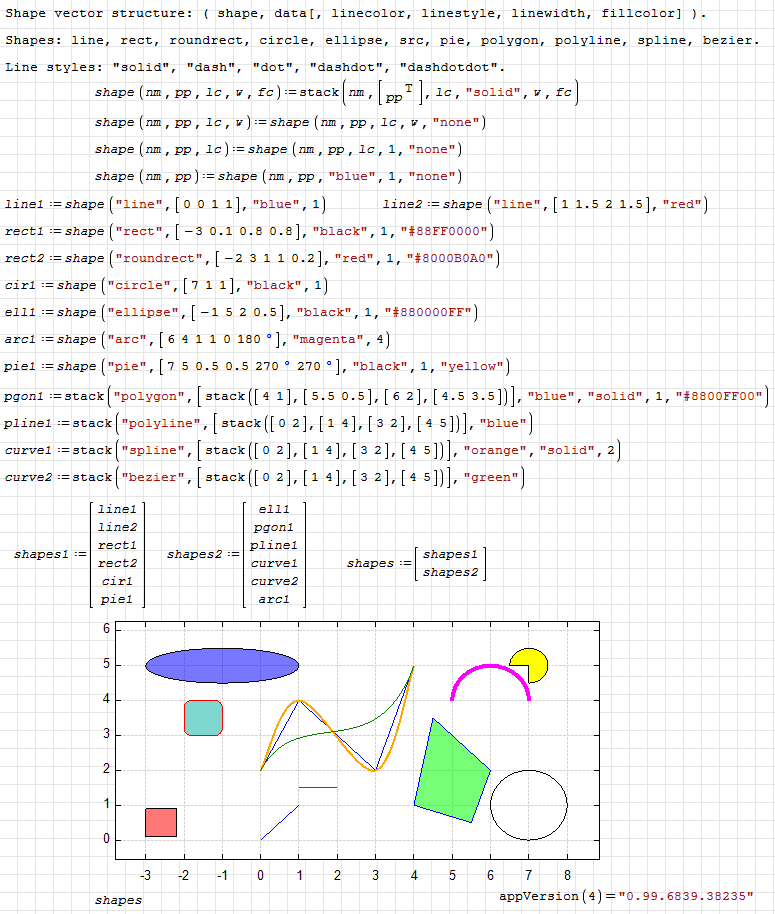
XYPlot. Draw shapes.sm (19,85 КиБ) скачан 2822 раз(а).
XYPlot. Draw shapes.pdf (92,91 КиБ) скачан 1895 раз(а).
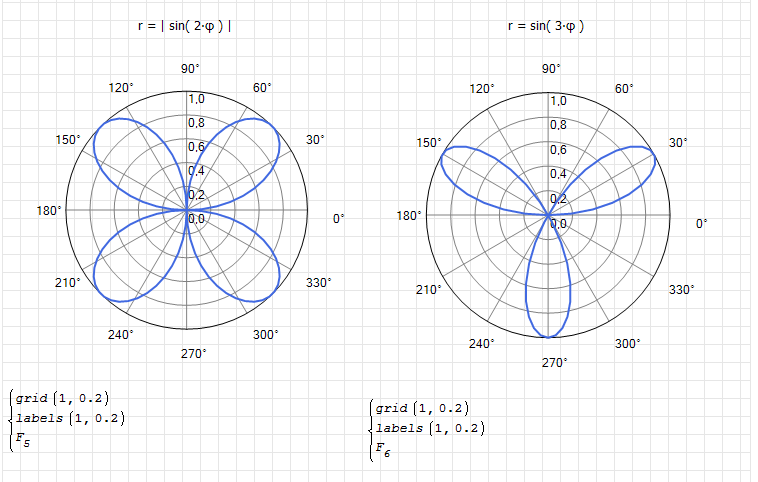
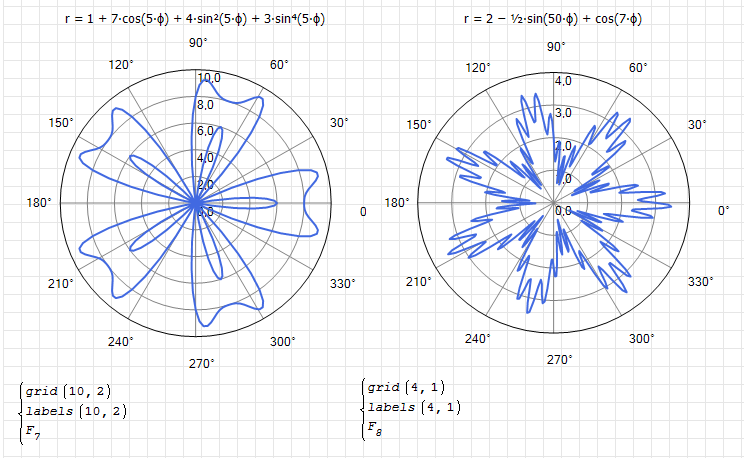
XYPlot. Linear polar.sm (56,78 КиБ) скачан 2168 раз(а).
XYPlot. Linear polar.pdf (134,78 КиБ) скачан 1344 раз(а).
3D plots in XY Plot plugin
pMesh.sm (244,1 КиБ) скачан 2204 раз(а).
pMesh.pdf (3,04 МиБ) скачан 1709 раз(а).
Functions for grids, meshes and plot surfaces. Support triangular meshes and multiple surfaces in the same plot.
pSurf.sm (315,64 КиБ) скачан 1971 раз(а).
pSurf.pdf (2,2 МиБ) скачан 1435 раз(а).
Small piece of code for filled 2-D contour plot in the XY plot plugin.
FillContour.sm (34,45 КиБ) скачан 2053 раз(а).
FillContour.pdf (306,44 КиБ) скачан 1439 раз(а).
Note: '~' is used as a mark for the "range" variable and should only be used inside the X-Y Plot.


Links:
1. Dr. Xu's Books .
2. Creating charts & graphics without coding .
XYPlot. Examples.sm (30,04 КиБ) скачан 3458 раз(а).
XYPlot. Examples.pdf (154,55 КиБ) скачан 2699 раз(а).
XYPlot. Demo.sm (5,5 КиБ) скачан 2441 раз(а).
XYPlot. Demo.pdf (45,63 КиБ) скачан 1961 раз(а).
XYPlot. Text labels.sm (10,1 КиБ) скачан 2425 раз(а).
XYPlot. Text labels.pdf (53,78 КиБ) скачан 1610 раз(а).
XYPlot. Fill area.sm (10,03 КиБ) скачан 2275 раз(а).
XYPlot. Fill area.pdf (84,35 КиБ) скачан 1423 раз(а).
XYPlot. Draw shapes.sm (19,85 КиБ) скачан 2822 раз(а).
XYPlot. Draw shapes.pdf (92,91 КиБ) скачан 1895 раз(а).
XYPlot. Linear polar.sm (56,78 КиБ) скачан 2168 раз(а).
XYPlot. Linear polar.pdf (134,78 КиБ) скачан 1344 раз(а).
3D plots in XY Plot plugin
pMesh.sm (244,1 КиБ) скачан 2204 раз(а).
pMesh.pdf (3,04 МиБ) скачан 1709 раз(а).
Functions for grids, meshes and plot surfaces. Support triangular meshes and multiple surfaces in the same plot.
pSurf.sm (315,64 КиБ) скачан 1971 раз(а).
pSurf.pdf (2,2 МиБ) скачан 1435 раз(а).
Small piece of code for filled 2-D contour plot in the XY plot plugin.
FillContour.sm (34,45 КиБ) скачан 2053 раз(а).
FillContour.pdf (306,44 КиБ) скачан 1439 раз(а).
Note: '~' is used as a mark for the "range" variable and should only be used inside the X-Y Plot.
Links:
1. Dr. Xu's Books .
2. Creating charts & graphics without coding .
Russia ☭ forever, Viacheslav N. Mezentsev
17 пользователям понравился этот пост
Oscar Campo 26.04.2013 09:38:00, frapuano 03.12.2016 09:11:00, Mark R Harris 29.08.2022 07:50:00, sergio 13.01.2024 04:42:00, Radovan Omorjan 26.04.2013 10:32:00, Infinity 29.04.2013 03:12:00, ioan92 25.05.2025 13:21:50, ruddy 24.09.2025 00:30:07, Valery Ochkov 29.10.2025 15:15:21, Fridel Selitsky 26.04.2013 10:29:00, Davide Carpi 26.04.2013 10:12:00, Martin Kraska 26.04.2013 09:39:00, IVR 13.07.2013 05:09:00, yajurito 11.12.2017 17:33:00, Andrey Ivashov 22.09.2021 08:49:00, zoom 17.01.2016 17:14:00, maria 02.05.2025 03:56:13
Здорово!
I tried some functions (typed to the placeholder):
x - nothing happens
sin(x) - works
ln(x) - crash (perhaps due to undefined values)
any undefined function - crash
previously defined function returning a list - GUI freeze
I tried some functions (typed to the placeholder):
x - nothing happens
sin(x) - works
ln(x) - crash (perhaps due to undefined values)
any undefined function - crash
previously defined function returning a list - GUI freeze
Technische Mechanik mit SMath Studio: https://link.springer.com/book/10.1007/978-3-658-50592-9

Nice work uni 
A way could be to use context menu items (see ConstructorRegion plugin by Andrey)... also the Mathcad mode it's quite interesting...
you can post the plugin code?
WroteYou can change only the function for now. Need to figure out a way how to pass parameters to display the graph or do it like in Mathcad.
A way could be to use context menu items (see ConstructorRegion plugin by Andrey)... also the Mathcad mode it's quite interesting...
you can post the plugin code?
If you like my plugins please consider to support the program buying a license; for personal contributions to me: paypal.me/dcprojects

325 сообщений из 2 052 понравились и 1 не понравились пользователям.
Группа: Moderator
This is a long time waiting feature and I think we are all excited about it 
Good luck uni
Radovan
EDIT: I tried it a bit in a "faulty" Mono in Xubuntu. It si working initially although with crashes as Martin mentioned
Good luck uni
Radovan
EDIT: I tried it a bit in a "faulty" Mono in Xubuntu. It si working initially although with crashes as Martin mentioned
When Sisyphus climbed to the top of a hill, they said: "Wrong boulder!"
The code is taken from this book:
C# Application Series - Xu J. - Practical C# Charts and Graphics [2007, PDF, ENG] (link, rus).
I have something removed and added something to get the plugin. I added sources.
mkraska, not so fast Try some number.
C# Application Series - Xu J. - Practical C# Charts and Graphics [2007, PDF, ENG] (link, rus).
I have something removed and added something to get the plugin. I added sources.
mkraska, not so fast
Try some number.Russia ☭ forever, Viacheslav N. Mezentsev
2 пользователям понравился этот пост

If you like my plugins please consider to support the program buying a license; for personal contributions to me: paypal.me/dcprojects
thank you very much uni!
please look at this post:
http://en.smath.info/forum/yaf_postsm9105_Plots-improvements.aspx#post9105
ZedGraph is c# targeting .net20 so it should work both in windows and linux.
please look at this post:
http://en.smath.info/forum/yaf_postsm9105_Plots-improvements.aspx#post9105
ZedGraph is c# targeting .net20 so it should work both in windows and linux.
Thank you uni.
This is long overdue.
As you develop it, please have in mind the basic form of axes: Lin-Lin, Lin-Log, Log-Log.
Basile
This is long overdue.
As you develop it, please have in mind the basic form of axes: Lin-Lin, Lin-Log, Log-Log.
Basile
325 сообщений из 2 052 понравились и 1 не понравились пользователям.
Группа: Moderator
Wrote...Try some number.
Regards,
Radovan
When Sisyphus climbed to the top of a hill, they said: "Wrong boulder!"
Radovan,
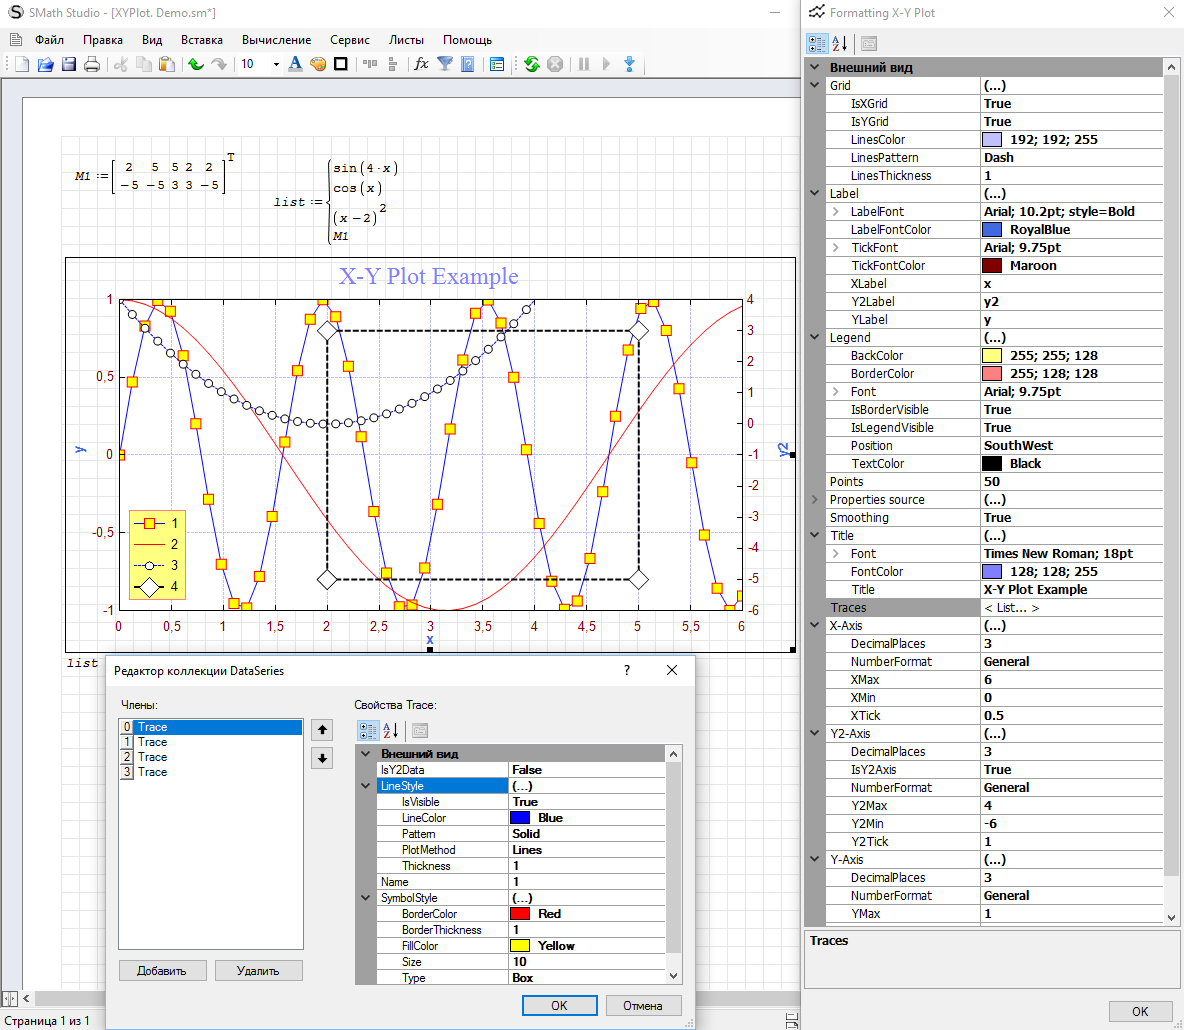
How did you put graph title and axis titles? and axes greater than 1.
Thank you,
Basile
How did you put graph title and axis titles? and axes greater than 1.
Thank you,
Basile
Updated. Form formatting is added to the context menu. Changes take effect after the recalculation. You can use system for several functions but be careful (not tested yet).
Russia ☭ forever, Viacheslav N. Mezentsev
2 пользователям понравился этот пост
325 сообщений из 2 052 понравились и 1 не понравились пользователям.
Группа: Moderator
Hello Basile
I did nothing else just put a number in the function placeholder, as uni said. It seems that uni just put this example just as a test at the moment.
Lots of user feedback in quite a short time shows that we are very interested in this plugin. It seems that we need to have some more patience until the very appreciated plugin like this become more stable , and than to test it more carefully
Regards,
Radovan
WroteHow did you put graph title and axis titles? and axes greater than 1.
I did nothing else just put a number in the function placeholder, as uni said. It seems that uni just put this example just as a test at the moment.
Lots of user feedback in quite a short time shows that we are very interested in this plugin. It seems that we need to have some more patience until the very appreciated plugin like this become more stable
, and than to test it more carefully Regards,
Radovan
When Sisyphus climbed to the top of a hill, they said: "Wrong boulder!"
Thank you again.WroteLast update: XYPlotRegion_20130427.zip
You can change only the function for now. Need to figure out a way how to pass parameters to display the graph or do it like in Mathcad.
Sources: https://smath.info/svn/public/plugins/XYPlotRegion/
Updated.
Russia ☭ forever, Viacheslav N. Mezentsev
5 пользователям понравился этот пост
Radovan Omorjan 27.04.2013 07:07:00, sergio 27.04.2013 09:25:00, Martin Kraska 28.04.2013 03:04:00, Fridel Selitsky 27.04.2013 07:16:00, Davide Carpi 27.04.2013 06:43:00
Thanks.
The traces & Number Format function is not working for me (Win 7 64 Bit).
The traces & Number Format function is not working for me (Win 7 64 Bit).
WroteUpdated.
The last update seems to focus on handling lists of plots. The plugin seems to be under heavy construction.
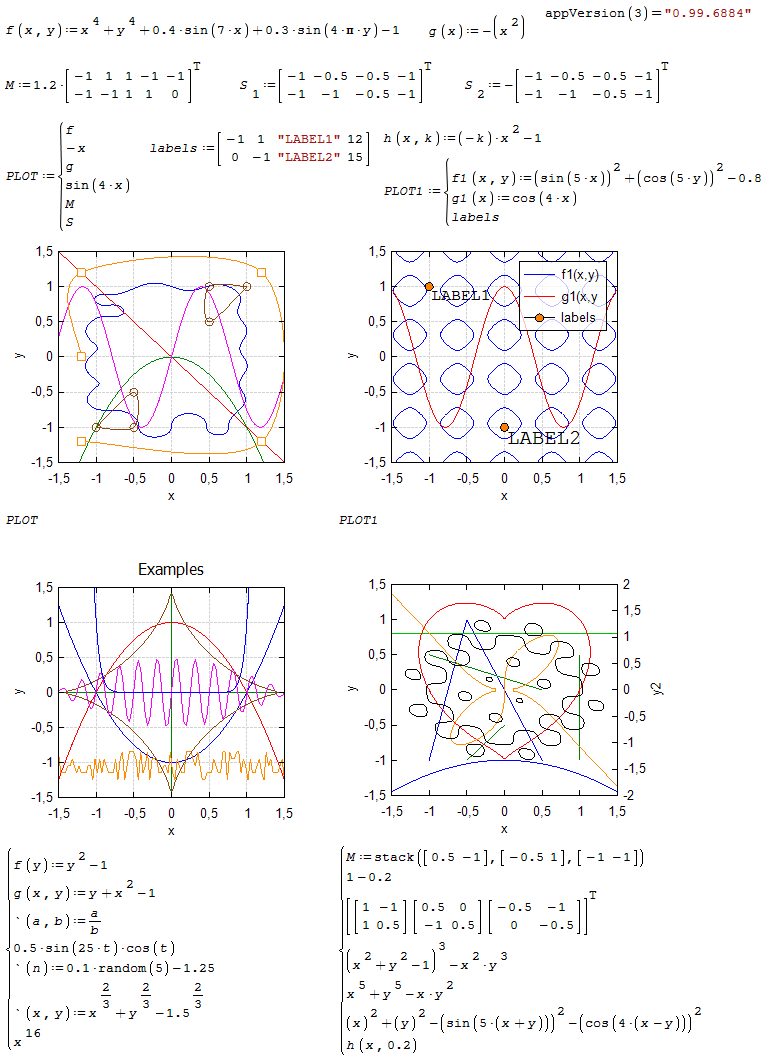
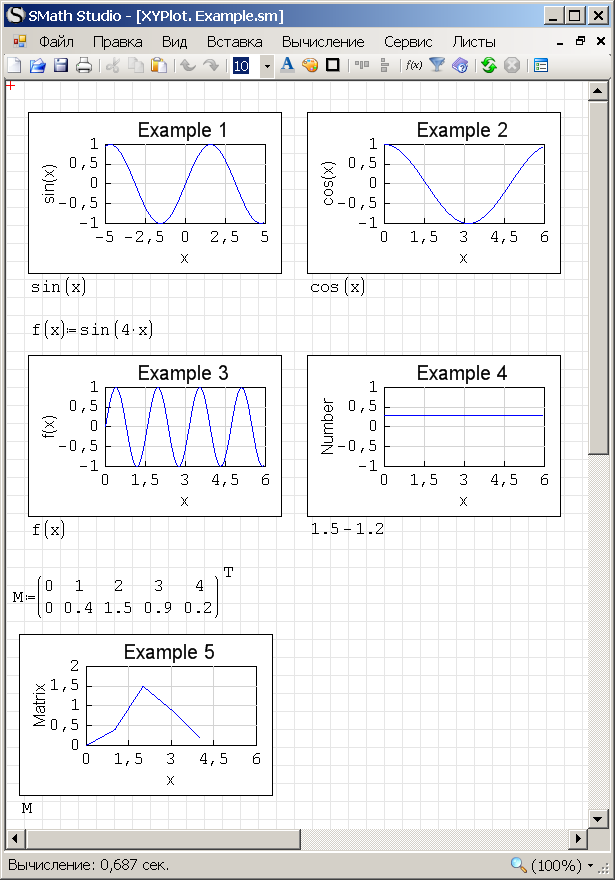
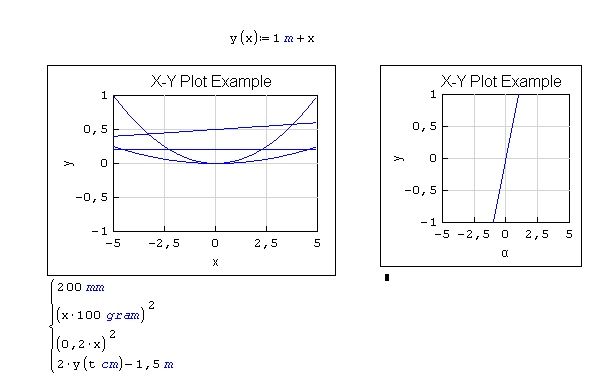
For plotting functions, the xyplotrregion just evaluates the name, without caring for the argument, therefore plotting pure expressions just as x or x^2 fails.
Also, numbers must be pure numbers, not expressions that can be evaluated to numbers.
I guess that the built-in demo shows sort of development target. It would be interesting to know if expression input for plot items and range limits including unit handling are on the agenda. Anwyway, I am looking forward to the next release.
Technische Mechanik mit SMath Studio: https://link.springer.com/book/10.1007/978-3-658-50592-9
WroteThanks.
The traces & Number Format function is not working for me (Win 7 64 Bit).
These tabs will be added later. Working on it.
Updated.
Russia ☭ forever, Viacheslav N. Mezentsev
2 пользователям понравился этот пост
Wrote
Updated.
Crashing xyplot:
- loading documents created with earlier versions of the plugin
- expressions evaluating to lists but not being lists (e.g. [MATH]±1[/MATH])
Not crashing xyplot:
- using units
empty placeholder produces a line y=x
Is using limit expressions including units (perhaps using placeholders as in old mathcad) on the agenda?
Technische Mechanik mit SMath Studio: https://link.springer.com/book/10.1007/978-3-658-50592-9
1 пользователям понравился этот пост
Вячеслав Мезенцев 28.04.2013 10:08:00
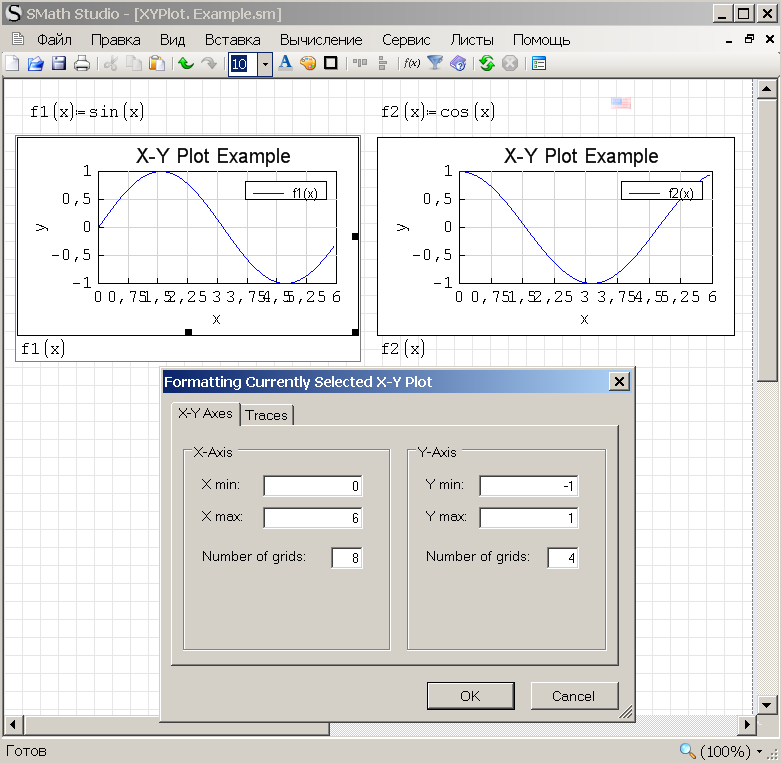
There is only one placeholder, so I can enter only the expression and nothing more. I don't know whether it is possible to add more placeholders. Limits for the graphs need to be set explicitly (in the formatting dialog).
Russia ☭ forever, Viacheslav N. Mezentsev
Could global variables be an option?
The user might define or display values of settings like
XYPlot.xmin:0
XYPlot.xmax:3'm -> this would give the independent variable a unit
XYPlot.ymin:0
XYPlot.ymax:"auto" (auto-scaling)
XYPlot.xaxis:"log" or "lin"
XYPlot.title:num2str(n)
XYPlot.xtics:0,5*'m
etc. This would be quite transparent and readable, but could be hidden in collapsable regions if required.
Settings in the context menu might change or override the variable values or restore them to defaults.
Units could be automatically added to the default axis label if appropriate. You could, however, leave proper annotation in the user's responsibility.
Sticking to some naming convention (e.g. gnuplot) would facilitate the usage.
Technische Mechanik mit SMath Studio: https://link.springer.com/book/10.1007/978-3-658-50592-9
1 пользователям понравился этот пост
Radovan Omorjan 03.06.2013 07:24:00
- Новые сообщения
- Нет новых сообщений