X-Y Plot Region - Extends SMath Studio with a X-Y Plot Region. - Сообщения
Wrote...when you need to share files between countries with different regional standards...
I guess that's what we do all the time in the forum...
localization is important for me, as I use SMath for teaching and I want the students to stick to national standards (or international ones and that includes writing in english, which most of them feel not comfortable with - that's why the handbook is in german).
Due to the central location of settings it is not easy to maintain uptodate installations with different settings for testing. I feel much relieved by using the portable ("linux" ) version with plugins, that allows installation of plugins on the fly without being asked for admin rights. However, this version does not have any settings file in the install dir.
Another issue:
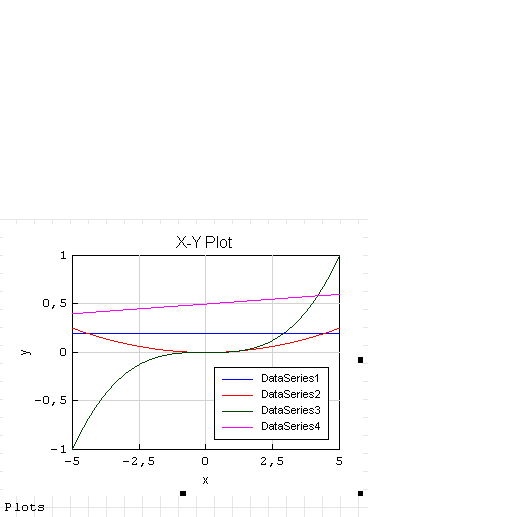
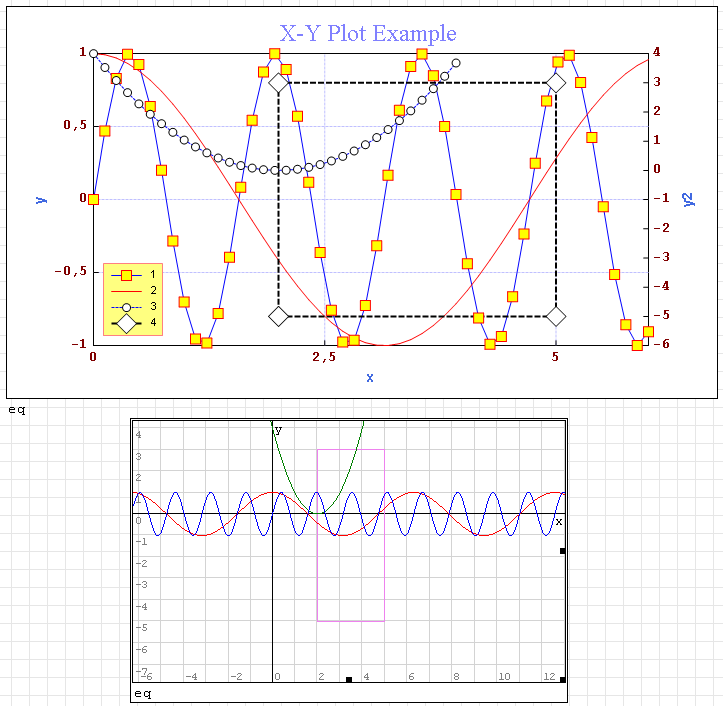
I get problems with co-existing plot regions from the plugin and smath internal. See attached file. The first image is generated by save as and seems to be ok, the display however, is buggy (second image).
This does not happen with the example by Ber7.

Wrote
Another issue:
I get problems with co-existing plot regions from the plugin and smath internal. See attached file. This does not happen with the example by Ber7.
Yes, I noticed that. Also, when recalculating the document a lot of times artifacts appear and region disappear. I don't know what's happening.
Let's look again. Create each of you a simple sm-file (not smz) with one X-Y Plot and attach it to your message.

325 сообщений из 2 052 понравились и 1 не понравились пользователям.
Группа: Moderator
I managed to open your example file for the first time
 - find attached (just made a small correction in the title)
 As you asked, I attached a new simple plot (find attached please)
If you need anything else, just let us know.
By the way, I do not quite understand the Add, Remove under Traces|Members (Chart2Dlib.DataSeries). Add will issue an error, Remove will remove formatting. I suppose this option is under development.
Regards,
Radovan
XYPlot.omorr.sm (3,11 КиБ) скачан 1401 раз(а).
- formatting problem persists,
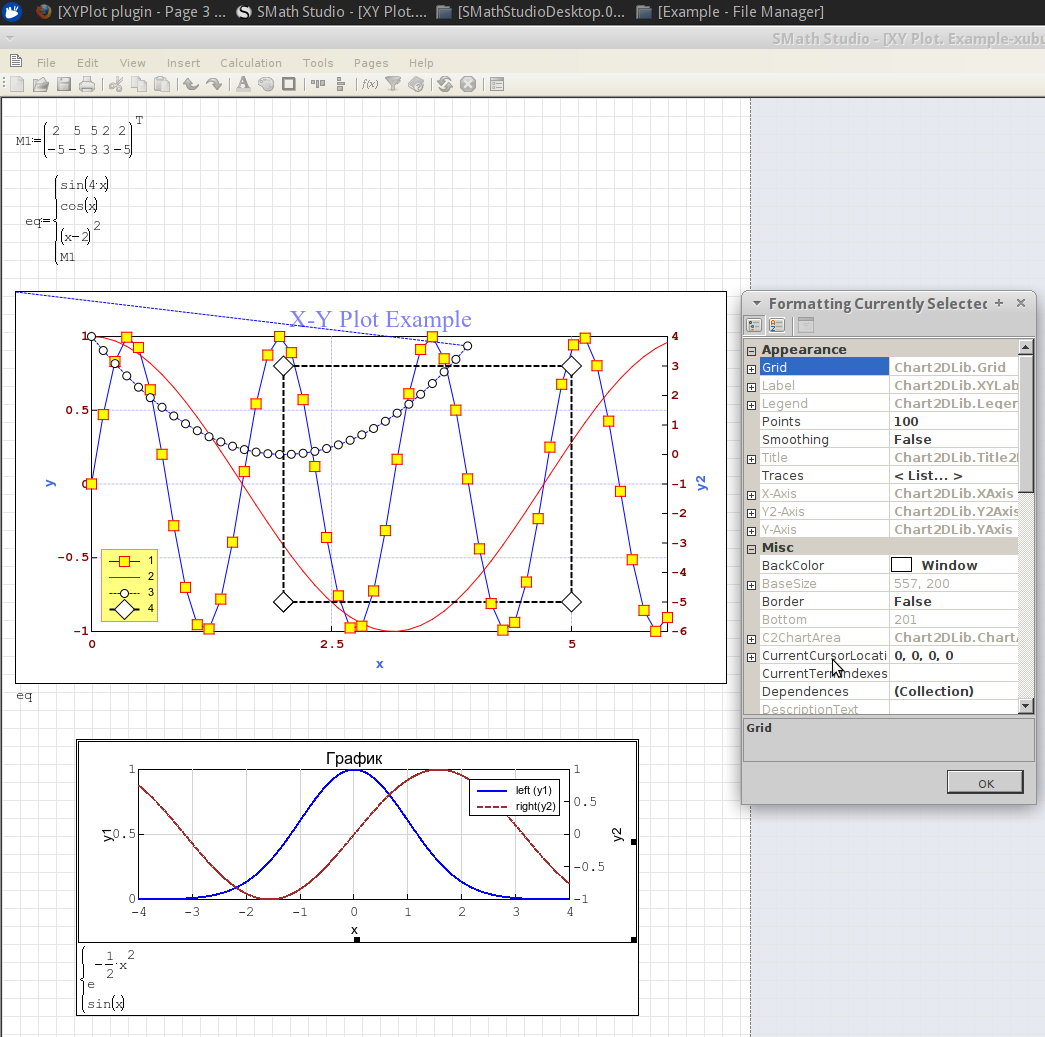
- undefined values (ln for negative x) add a spurious dataset and disable plotting.
- wrong position of (x-2)^2 curve and matrix in the plugin demo EDIT: they belong to y2, I did not guess that from the plot and failed to check prior to complaining...)
Some of the properties can be changed with the mousewheel. Some of them seem to loose mouse focus after a change, such that the mousewheel does not have any effect until the cell is clicked again (e.g. in the line color tab )
I would suggest to make the user colors default tab in the line color property. The 2D color chooser is much more convenient than the huge lists (web, system)
Could the dataseries properties be directly exposed in the main screen?
WroteHello uni,
I managed to open your example file for the first time
As you asked, I attached a new simple plot (find attached please)
If you need anything else, just let us know.
By the way, I do not quite understand the Add, Remove under Traces|Members (Chart2Dlib.DataSeries). Add will issue an error, Remove will remove formatting. I suppose this option is under development.
Regards,
Radovan
Ok, now I can open your files (but for the second file StatisticalTools plugin require). As for the Add, Remove under Traces|Members (Chart2Dlib.DataSeries) - do not use this feature (it should not be there).
Цитатаwrong position of (x-2)^2 curve and matrix in the plugin demo
And what about y2 axis? [IsY2Data = true] for these curves.
P.S.
Цитата- formatting problem persists,
- undefined values (ln for negative x) add a spurious dataset and disable plotting.
Working on it.
As for the formatting form I use standart propertyGrid control. It works fully automaticaly and really hard for me change it behavior for now. May be in future.
These examples I can open too.
WroteЦитатаwrong position of (x-2)^2 curve and matrix in the plugin demo
And what about y2 axis? [IsY2Data = true] for these curves.
Oh, yes, you are right. Should have taken some more time to understand the picture.
325 сообщений из 2 052 понравились и 1 не понравились пользователям.
Группа: Moderator
I managed to save the file this time (Xubuntu upgraded to 13.04).
Regards,
Radovan
XY Plot. Example-xubuntu.sm (6,85 КиБ) скачан 1367 раз(а).
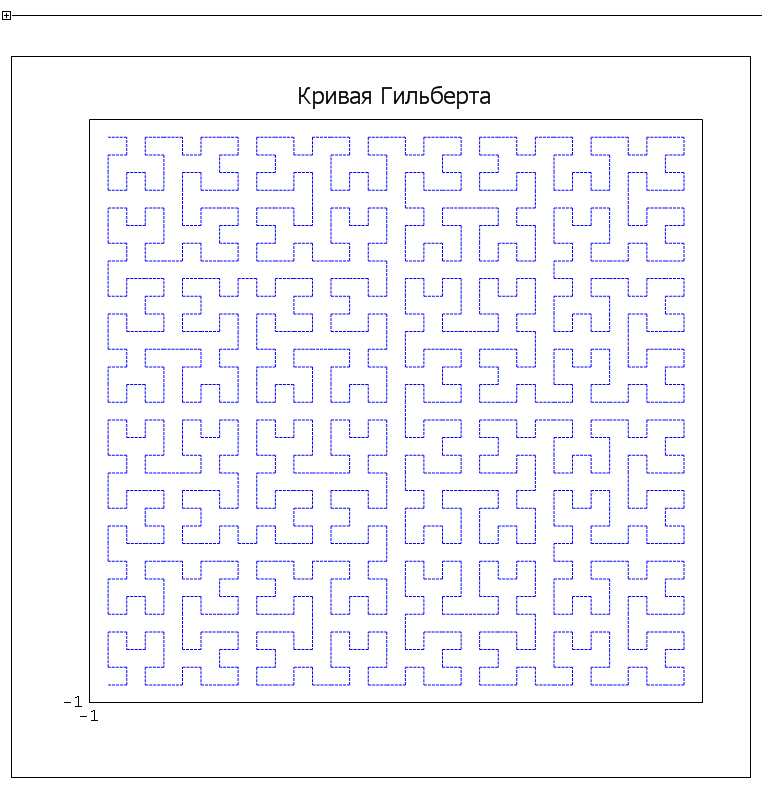
X-Y Plot. Hilbert Curve.sm (10,08 КиБ) скачан 1461 раз(а).
WroteUpdated: Fixed a display error. Small changes in the format again (I hope they last).
I had no problems to read files from the previous version. However, in one case, the commas (decimal delimiters) from the axes limit values had gone. Once corrected, they persist upon save and open.
I confirm that the problem of co-existing plots (internal and plugin) is fixed.
Remaining issues so far:
- Tick value formatting
- Tick origin (might be a feature, which I would request to change)
- Unhandled NaN values (in the internal plot region, a convenient way to limit a curve in x-direction is to divide by corresponding boolean expressions)
Would you recommend to start serious work (like Handbook examples...) based on the current file format? That would imply the hope that future versions shall be downward compatible w.r.t. file format.
demo4.sm (5,87 КиБ) скачан 1382 раз(а).
325 сообщений из 2 052 понравились и 1 не понравились пользователям.
Группа: Moderator
Regards,
Radovan
WroteCould global variables be an option?
The user might define or display values of settings like
XYPlot.xmin:0
XYPlot.xmax:3'm -> this would give the independent variable a unit
XYPlot.ymin:0
XYPlot.ymax:"auto" (auto-scaling)
XYPlot.xaxis:"log" or "lin"
XYPlot.title:num2str(n)
XYPlot.xtics:0,5*'m
etc. This would be quite transparent and readable, but could be hidden in collapsable regions if required.
Settings in the context menu might change or override the variable values or restore them to defaults.
Units could be automatically added to the default axis label if appropriate. You could, however, leave proper annotation in the user's responsibility.
Sticking to some naming convention (e.g. gnuplot) would facilitate the usage.
Updated.
Something like this? As for serious use, it's still early.
To use this feature: Properties Source->SourceType = Sheet, Index = n, n - index in limit vector (XLimMin, XLimMax, ...).
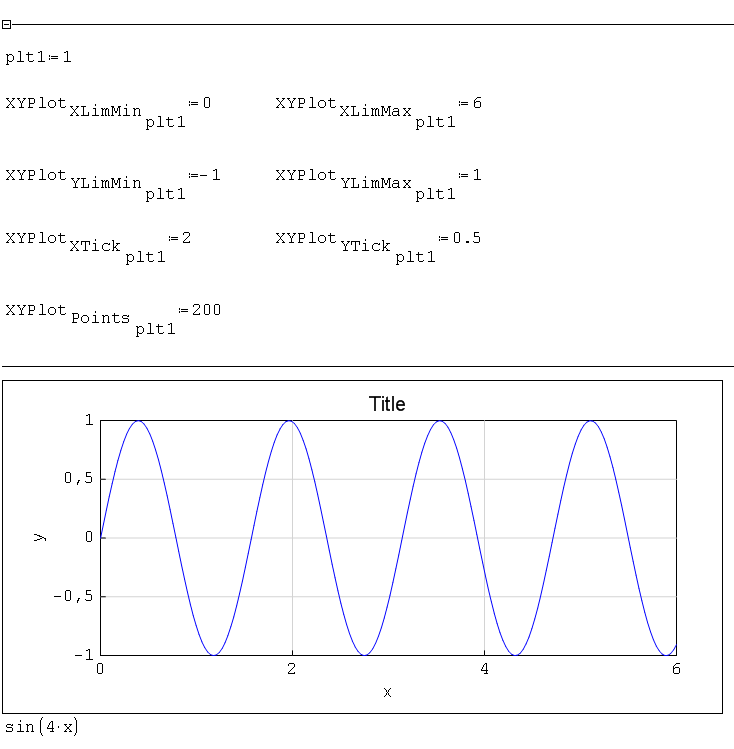
LimitsDemo1.sm (6,12 КиБ) скачан 1451 раз(а).
Wrote
Updated.
Something like this? As for serious use, it's still early.
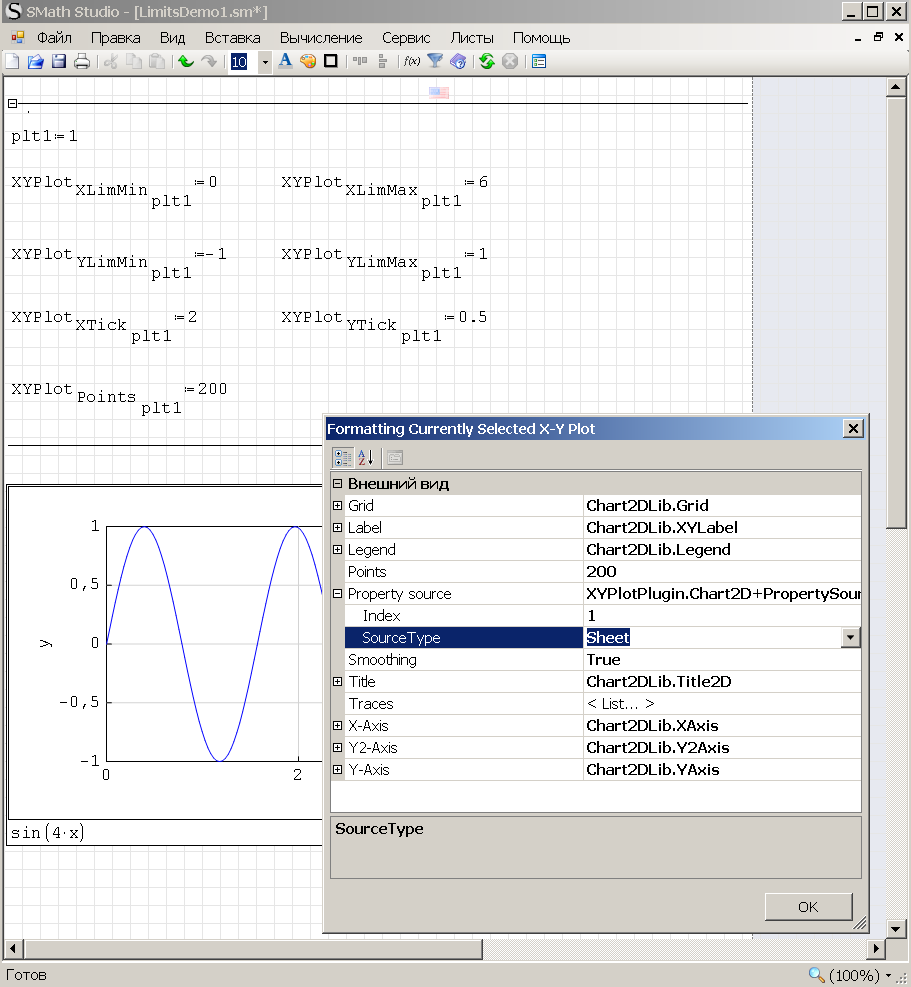
To use this feature: Properties Source->SourceType = Sheet, Index = n, n - index in limit vector (XLimMin, XLimMax, ...).
Yes, this could be great. Good solution how to control multiple plots with different settings. Unfortunately, your example does not work for me. I can see the setting in the properties form. They, however, do not have any effect. Or was that meant just as a feature preview?
Do you plan to have an axis ratio setting or locking option?
You should see a few more options. If they are not there it is strange.
I cannot download the r3.
Basile
325 сообщений из 2 052 понравились и 1 не понравились пользователям.
Группа: Moderator
WroteHello,
I cannot download the r3.
Basile
It seems that depends on the uni's ftp server. If the server is down, you can not download the plugin. Just try some later
Regards,
Radovan
WroteXYPlotRegion_20130501r3
You should see a few more options. If they are not there it is strange.
I just downloaded and installed r3 again. Still the same: Property source is set to sheet with correct index but changes in the values outside the plot do not have any effect.

- Новые сообщения
- Нет новых сообщений