X-Y Plot Region - Extends SMath Studio with a X-Y Plot Region. - Сообщения
Switching legend visibility off doesn't work, as soon as I click the canvas, the box re-appears. Copying the region to a new sheet (in version 8348) helps. There I can switch the legend off and it keeps off upon re-opening the file.
So a mitigation strategy would look like this:
- copy all content of the old file
- close the old file
- paste it into an empty new file
- switch off all the legends where required
- save the new file in place of the old one
Yet that doesn't work. If I copy all in one, the problem persists. My current hypothesis is that this might be some side effect of having too many plots or some malicious variable or whatever.
Can anyone reproduce this?
![2023-08-10 17_43_25-SMath Solver - [xyplot.sm].png](/ru-RU/files/Download/mhheSC/2023-08-10-17_43_25-SMath-Solver---[xyplot.sm].png)
xyplot.sm (239,2 КиБ) скачан 1959 раз(а).
Hello, when I open the file I get the following:
Best Regrads
Carlos

WroteIt is possible to change the behavior of the legend? Entries without names should not be displayed in the legend.
Five years ago, I changed the behavior of the legend. Since then, empty names hide elements of the legend. To return them, it is enough to have a space as the name.
1. Is Legend Visible ... False
2. Set Visible ... True ... small rectangle appears
3. Go to list ... name each trace.
4. Finish Legend properties.
WroteHello
Hello, when I open the file I get the following:
Best Regrads
Carlos
Hello, the legends haven't been lost but have't been there in the original version. So the problem is not that the contents of the legend is lost but that empty legends appear without intent.
So far, no one has had problems with the legend, except for the user mentioned above.
WroteDo you mean some very old file? Not the one attached to the post above.
So far, no one has had problems with the legend, except for the user mentioned above.
I produced the first issue of the Handbuch 9 years ago and it already had a section on XYplot (just looked it up in the SMath file manager). So, yes, the file is very old. It has been edited from time to time. In 2020, when I produced the last update, the images are ok, while now I faced the issue.
My guess is that at some point in time, the legend wasn't shown if all or some entries were empty. Perhaps you had to drop that logic when using empty entries to suppress the sample trace.
At least I am sure that I didn't deliberately switch on legends in all the plots without providing proper entries.
Yet I don't see what could be done about it, I just have to fix the legends in legacy files. Thanks for having a look at the issue.
WroteMy guess is that at some point in time, the legend wasn't shown if all or some entries were empty. Perhaps you had to drop that logic when using empty entries to suppress the sample trace.
In sm-files, each time it is saved, information about dependencies and their versions is recorded. The version information contains the build date of the plugin. This way we can determine exactly which version of the plugin is being used. Using the date information I can find out how the plugin worked and warn modern users.
So if one sets legend visibility to true but all trace names are empty, the names could be automatically populated with sensible names (e.g. a stringified version of the entry).
Also, in the name entry, a hint would be good that empty name removes the trace from the legend.
Thanks in advance.
Alvaro.
The marching cubes algorithm generates a random set of pieces, I added a function for ordering them. This is necessary for high-quality printing of a PDF document. Now, when zoomed in, all lines do not contain artifacts.
The algorithm itself has not yet been optimized, but it is quite working, since no one has complained about the picture yet.
WroteThis function is already implemented in the plugin. ...
Yes, I know. I ask for have the results outside the plugin, into a SMath matrix, as a fast way for discretizing a function or for further manipulations before making a plot.
Wrote...
The algorithm itself has not yet been optimized, but it is quite working, since no one has complained about the picture yet.
Just another reason for having its results as another usual SMath function, like CreateMesh.
Best regards.
Alvaro.
Edited: Maple have it:
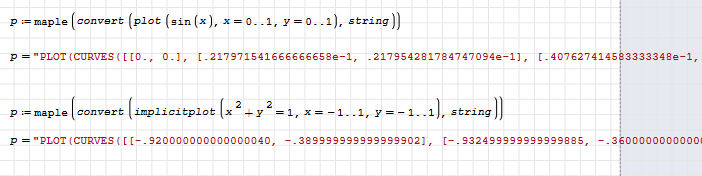
But forgot the structure. Just return the XY matrix with the values.

WroteBut forgot the structure. Just return the XY matrix with the values.
Even a regular graph can return a set of curves.
Wrote... Even a regular graph can return a set of curves.
Hi Viacheslav. I was thinking of something simple, like Mathcad does, which separates the traces with 'NaN' to be able to continue handling a single matrix. SMath doesn't have 'NaN', but someday I suppose it will. Meanwhile we can use 'NaN as a unit, although it doesn't help on graphs.
Best regards.
Alvaro.
WroteWhen opening old files with X-Y plots, I get spurious empty legend boxes in the plots.
Switching legend visibility off doesn't work, as soon as I click the canvas, the box re-appears. Copying the region to a new sheet (in version 8348) helps. There I can switch the legend off and it keeps off upon re-opening the file.
So a mitigation strategy would look like this:
- copy all content of the old file
- close the old file
- paste it into an empty new file
- switch off all the legends where required
- save the new file in place of the old one
Yet that doesn't work. If I copy all in one, the problem persists. My current hypothesis is that this might be some side effect of having too many plots or some malicious variable or whatever.
Can anyone reproduce this?
xyplot.sm (239,2 КиБ) скачан 1959 раз(а).
I found the reason for the problem. It is very simple. At the end of the file, I started experimenting with setprop and actually used setprop("XYPlot\002E\Legend\002E\IsLegendVisible",1). This seems to affect all plots with the name XYPlot (in the property settings), regardless if they are above or below the setprop command in the sheet. XYPlot happens to be the default name of all existing plots and setprop overrides any command from the settings dialog.
WroteI found the reason for the problem. It is very simple. At the end of the file, I started experimenting with setprop and actually used setprop("XYPlot\002E\Legend\002E\IsLegendVisible",1). This seems to affect all plots with the name XYPlot (in the property settings), regardless if they are above or below the setprop command in the sheet. XYPlot happens to be the default name of all existing plots and setprop overrides any command from the settings dialog.
Yes, that's how it works now. I mentioned somewhere that the feature is experimental. The function affects all plots on all sheets with the same name. Therefore, you can't use the default name. The function has global effect throughout the entire program. Despite this defect, its use can be useful.
The method on which the function works can't be used as the main tool, because the software implementation is too crude.
Wrotesetprop() function is just an intermediary. It knows nothing about the properties of an object. Thus, if a property is found during a call, then it will be set. Each time a function is called, it enumerates the available properties. It is possible that I will change this behavior by setting aliases for some properties, making the names shorter. For now you can use source code to get these names. As for the values, you can get them from sm file:
.gridpattern="Dash"
Hello , thanks for your developping the setprop function , it helps me free of setting quite similar plot options manually . But there exists some propertis that i can not find corresponding function form , could you help to identify these ? thanks in advance .
these properties are :
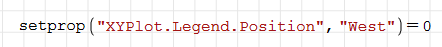
1. Legend -> Positon , it failed to set option using this function form:
2.Traces -> each trace's name , LineStyle-> LineColor, SymbolStyle->Type
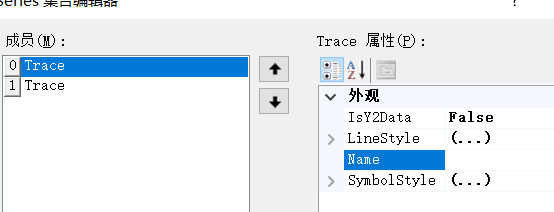
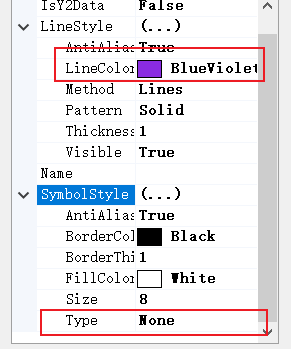
I frequently use these options to visulize the combination of general curve and sactter curve , so it's nice to use its coreesponding setprop function form.
any help is welcome , thanks!
setprop() function uses the original property names to access their values. It's not intuitive, but it's done that way for now. This property naming is used for compatibility with older versions of the plugin. Perhaps I'll make them easier to use while maintaining compatibility.
As for changing the properties of individual curves, this is not automated yet. I can't yet implement a universal method that would be understandable to users. In general, this is possible, but has not yet been implemented.
Plugin updated.
Changes:
- the original property names for the legend changed to make the function setprop() easier to use.
When cloning a component and changing its name, the function setprop() doesn't work. When inserting a component, the function works fine. I didn't notice this before.
WroteNot all properties have equivalent names. They can be found in the plugin source code. Some are customizable and some are not.
setprop() function uses the original property names to access their values. It's not intuitive, but it's done that way for now. This property naming is used for compatibility with older versions of the plugin. Perhaps I'll make them easier to use while maintaining compatibility.
As for changing the properties of individual curves, this is not automated yet. I can't yet implement a universal method that would be understandable to users. In general, this is possible, but has not yet been implemented.
ok, and having a nice day , thanks again uni.
- Новые сообщения
- Нет новых сообщений