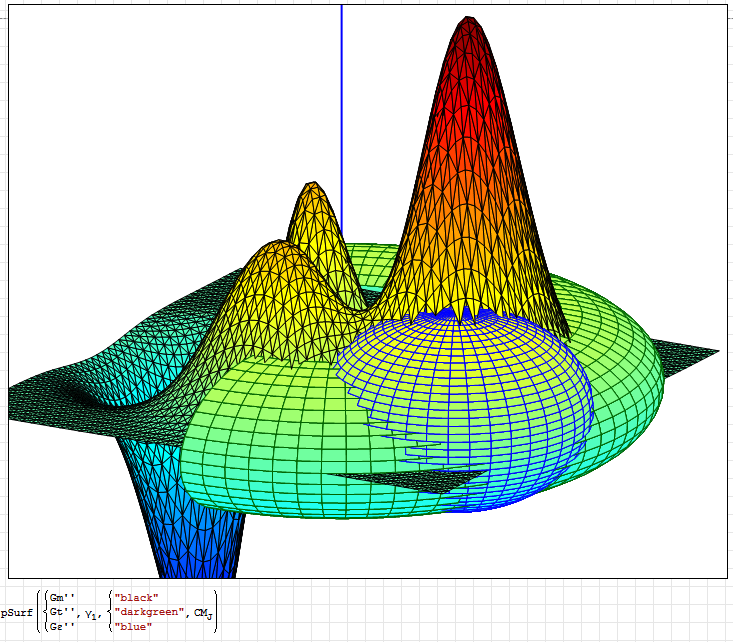
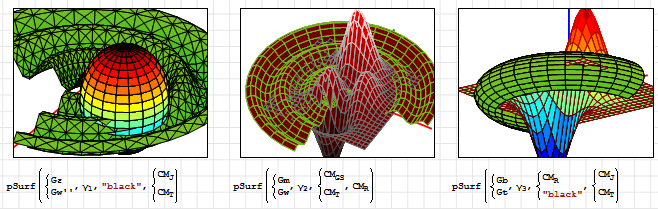
X-Y Plot Region - Extends SMath Studio with a X-Y Plot Region. - Сообщения
WroteIf you sometimes see a similar problem, then this is an error in the operation of a parallel algorithm used to speed up data processing.
Are these indecent lines result for same kind of problem?
It doesn't matter when cases() used by the way, same issue.
Regards
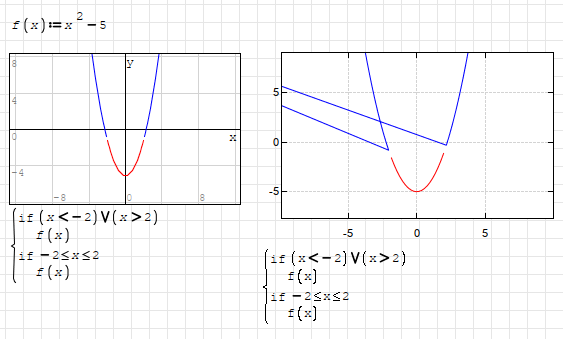

WroteAre these indecent lines result for same kind of problem?
No, this problem is related to the drawing algorithm. This algorithm skips points that cannot be drawn. It doesn't always work correctly at the end of lines. I am aware of this and have not yet found the time to rewrite the algorithm to be more universal.
However, I don't understand:
1. Why does a vector line matrix needs to be contained within a 1x1 matrix? I'm guessing that is the answer: ie it needs to be 1 element to be parsed. Is that correct?
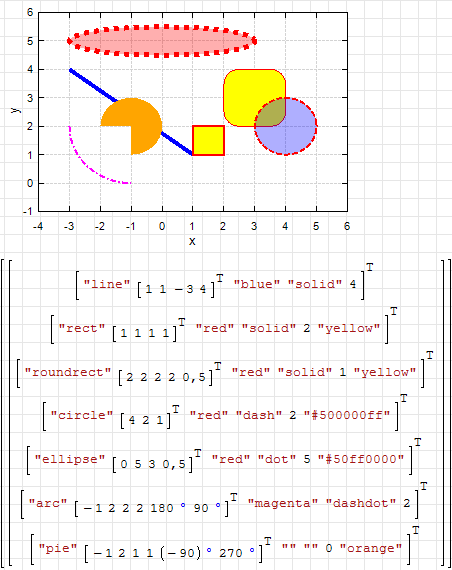
2. How do you create fill? For example, green fill between the points (0,0), (1,0), (1,1) and (0,1)?
Thanks!
Wrote
2. How do you create fill? For example, green fill between the points (0,0), (1,0), (1,1) and (0,1)?
The pre-defined objects in the XY-Plot-plugin might help.
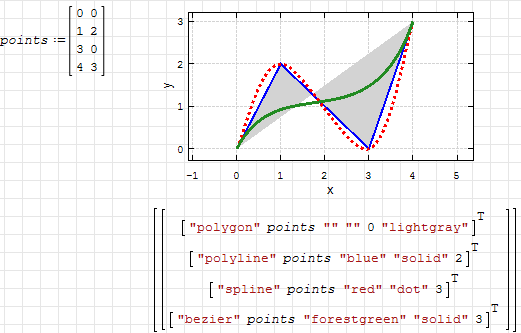
I'm doing something wrong:
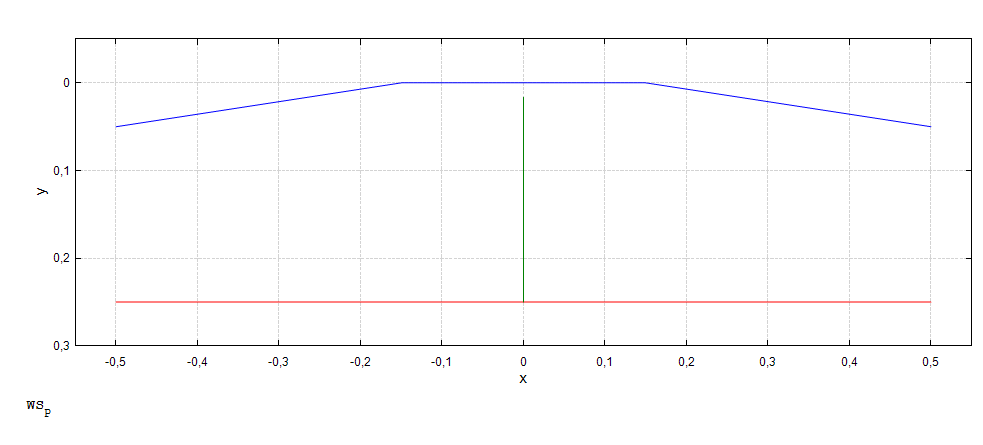
Not Working.sm (5,97 КиБ) скачан 1293 раз(а).
WroteI'm doing something wrong:
Rename your matrix point to points.
Is there a list/documentation somewhere of the built-in objects?
Or have a look at the interactive handbook: Graphics> 2D plots (plugin X-Y Plot)
Also, have a look at the topic starter post of this thread, there is extensive documentation on this plugin.
An excellent reference. Thank you Martin.
I'm hoping to plot polygons with complex number vertices as the coordinate pairs: ie x-coordinate = the real part, and y-coordinate = the imaginary part.
Is that possible? If not, would native handling of complex numbers as coordinate pairs by XYPlot be useful?
I've looked at both section 8.3.4 of the German handbook and also the Tools>Plugins>Interactive Handbooks>Interactive SMath Handbook>Graphics>2D Plots>X-Y Plot and can't find anything regarding complex number handling.
This kind of thing:
20230131 Triangle Test Complex XYPlot.sm (102,31 КиБ) скачан 1326 раз(а).
Thank you!
WroteXYPlot: Plot Polygons: Complex Number Column Vectors ...
Hi. This could be an option.
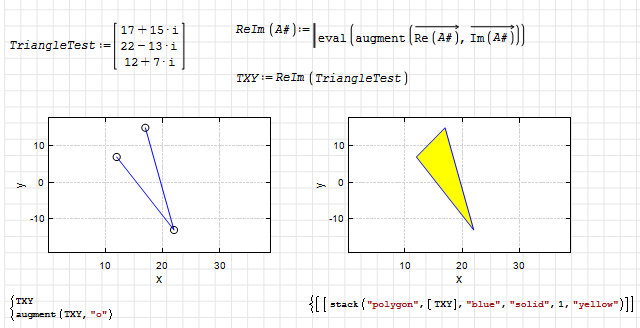
20230131 Triangle Test Complex XYPlot.sm (106,76 КиБ) скачан 1348 раз(а).
Best regards.
Alvaro.
WroteIs that possible? If not, would native handling of complex numbers as coordinate pairs by XYPlot be useful?
It can be done, but I doubt that it is necessary. Can you give an example where such an interpretation of complex numbers is used? I mean famous mathematical applications.
No sorry, I'm just an engineer.
Stuff I'd use it for are:
* Visualsation of complex impedances (eg RF matching, filters, branching etc), and
* 2D visualisation (eg polygons for estimation of state).
It would make making plots that are supposed to be proportional much easier.
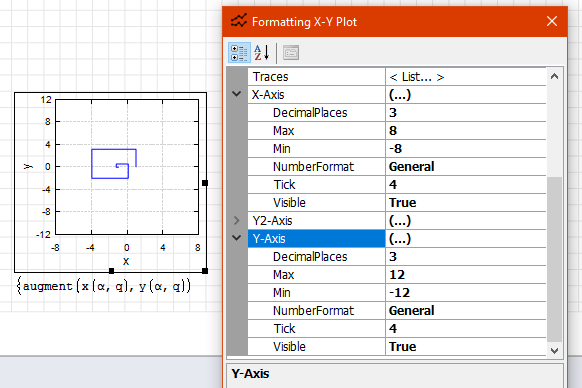
For example keeping this drawing square would be much easier:
WroteHi would it be possible to add an option to make splot square or have arbitrary X/Y proportion?
If I understood you correct, this option already exist.
Try to scroll with control or shift key pressed. This will either change X or Y scale depending the key used.
Regards
WroteHi would it be possible to add an option to make splot square or have arbitrary X/Y proportion ?
You can use the square plot technique on either or both direction
Tabulate X & Y ... (X*a)±b,,,(Y*c)±d
WroteFor example keeping this drawing square would be much easier:
Here your functions plotted to square region.
Regards
I want the drawing to be proportional.
WroteMy bad, what I need is to have the grid be square not the entire plot.
I want the drawing to be proportional.
Hi. Double clicking on the plot, you can access to the grid options for changing the 'Tick' value.
Best regards.
Alvaro.
- Новые сообщения
- Нет новых сообщений