X-Y Plot Region - Extends SMath Studio with a X-Y Plot Region. - Сообщения
Установил Development Tools. Но программа 'tst_xyplot_v2.sm' все равно не работает (но, наверное, этот плагин не для этого). В приложении - файл с моей системной информацией.
sys_info.txt (1,39 КиБ) скачан 813 раз(а).
sys_info.txt (1,39 КиБ) скачан 813 раз(а).

В папке плагина есть конфигурационный файл: %APPDATA%\SMath\extensions\plugins\c12231ec-4873-43c1-a7d0-a167ebd17066\0.3.9106.25707\XYPlotPlugin.config
Закройте SMath Studio и измените значение Debug в True:
После этого запустите SMath Studio. В этой же папке появится файл лога: XYPlotRegion.log
Приложите его сюда тоже. Там будет указано какая версия .Net используется плагином для работы.
Закройте SMath Studio и измените значение Debug в True:
<Debug>True</Debug>После этого запустите SMath Studio. В этой же папке появится файл лога: XYPlotRegion.log
Приложите его сюда тоже. Там будет указано какая версия .Net используется плагином для работы.
Отредактировано 24.07.2025 08:45:42
Russia ☭ forever, Viacheslav N. Mezentsev
Sorry, switched to Russian. The file attached is the log-file after the prescribed 'magic' actions  It is written in the file 'Net: 2.0...' I guess it is not what we need.
XYPlotRegion.log (574 Б) скачан 915 раз(а).
It is written in the file 'Net: 2.0...' I guess it is not what we need.XYPlotRegion.log (574 Б) скачан 915 раз(а).
Отредактировано 24.07.2025 13:11:27
It's strange that the old version of the framework is selected instead of the new one. In fact, this particular plugin is compatible with the old version, but I haven't tested it in such an environment for a long time.
Perhaps this is the reason.
For everyone else, including me, the new version of the framework is apparently selected.
You can try installing .Net Framework 4.8, for example. Maybe this will help.
Perhaps this is the reason.
For everyone else, including me, the new version of the framework is apparently selected.
You can try installing .Net Framework 4.8, for example. Maybe this will help.
Russia ☭ forever, Viacheslav N. Mezentsev
I was able to reproduce the problem. It is indeed a version issue.
You can also try another solution.
You can try changing the contents of the file: C:\Program Files (x86)\SMath Studio\Solver.exe.config
You can try to remove the old version by deleting the line with it and adding the existing version. You can ask the deepseek to suggest a variant of writing these lines.
P.S. I fixed the error. The fix will be available in the next version of the plugin. The problem was in the plugin sources.
You can also try another solution.
You can try changing the contents of the file: C:\Program Files (x86)\SMath Studio\Solver.exe.config
  <startup useLegacyV2RuntimeActivationPolicy="true">
    <supportedRuntime version="v4.0" sku=".NETFramework,Version=v4.8" />
    <supportedRuntime version="v2.0.50727" />
  </startup>
You can try to remove the old version by deleting the line with it and adding the existing version. You can ask the deepseek to suggest a variant of writing these lines.
P.S. I fixed the error. The fix will be available in the next version of the plugin. The problem was in the plugin sources.
Отредактировано 24.07.2025 15:49:28
Russia ☭ forever, Viacheslav N. Mezentsev
It works finally. I can see now all plots in program 'tst_xyplot_v2.sm'. I could not download NET Framework 4.8 (some errors). But, as you suggested, I found a version of NET Framework installed on my computer (4.0.30319). I have changed "v2.0.50727" in the second line of 'supportedRuntime ...' to my number, and it works. Thank you for your help. I am really impressed by your dedication, supporting plugins and helping people for more than 15 years.
Отредактировано 24.07.2025 15:58:24
2 пользователям понравился этот пост
Plugin updated. Please try.
Changes:
- added support for high DPI when displaying fonts;
- fixed the CopyTo() method in HashSet.cs;
- supplemented the error message when trying to display complex numbers.
The last problem was related to an incorrect manual implementation of the CopyTo() method, which only now became apparent.
Russia ☭ forever, Viacheslav N. Mezentsev
2 пользователям понравился этот пост
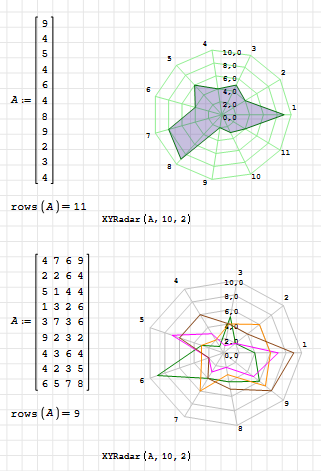
Funny bug. When drawing shapes, the fill is also drawn, even if it is disabled in the curve properties. If you superimpose circles on top of each other, it creates the impression that the color depends on the radius.
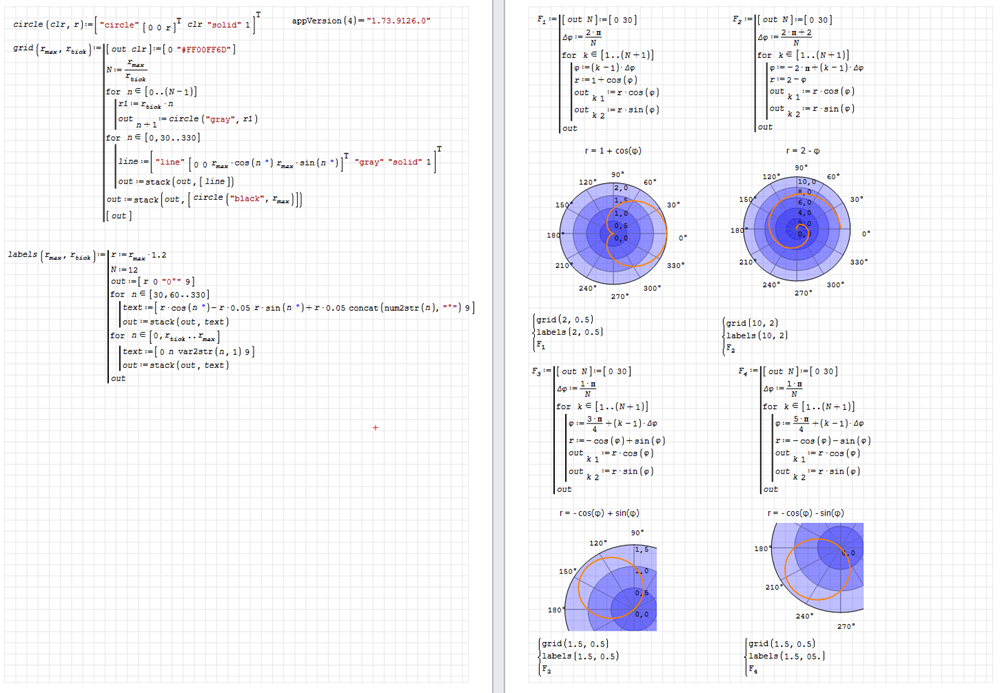
XYPlot. Linear polar.sm (56,78 КиБ) скачан 2168 раз(а).
XYPlot. Linear polar.pdf (134,78 КиБ) скачан 1344 раз(а).
XYPlot. Linear polar.sm (56,78 КиБ) скачан 2168 раз(а).
XYPlot. Linear polar.pdf (134,78 КиБ) скачан 1344 раз(а).
Отредактировано 25.07.2025 07:15:58
Russia ☭ forever, Viacheslav N. Mezentsev
I think I can adapt this syntax to customize the properties of a set of curves.
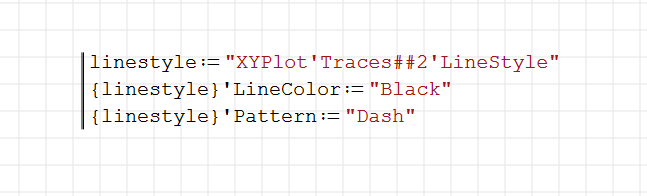
.Traces##. - for all curves
.Traces#i#j. - for curves from i to j
.Traces##j. - for curves from 1 to j
.Traces#i#. - for curves from i to end
Отредактировано 25.07.2025 12:46:02
Russia ☭ forever, Viacheslav N. Mezentsev
1 пользователям понравился этот пост
Rafael H Padilla Velázquez 25.07.2025 15:39:21
WroteFunny bug. ...
Hi Viacheslav. A workaround for the bug, and a simplified way to those plots.
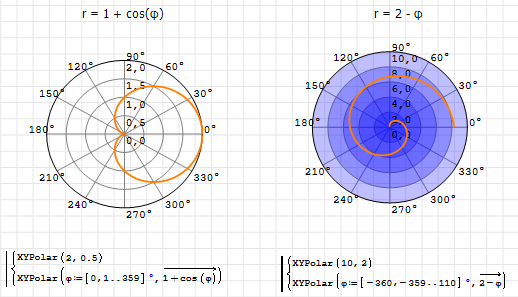
XYPolar.sm (42,8 КиБ) скачан 1101 раз(а).
Best regards
Alvaro.
Отредактировано 25.07.2025 17:52:20
1 пользователям понравился этот пост
Вячеслав Мезенцев 25.07.2025 19:28:38
Plugin updated. Please try.
Changes:
- fixed the problem with background filling when drawing shapes.
Russia ☭ forever, Viacheslav N. Mezentsev
Wrote... Plugin updated. Please try.
It works fine.
Best regards.
Alvaro.
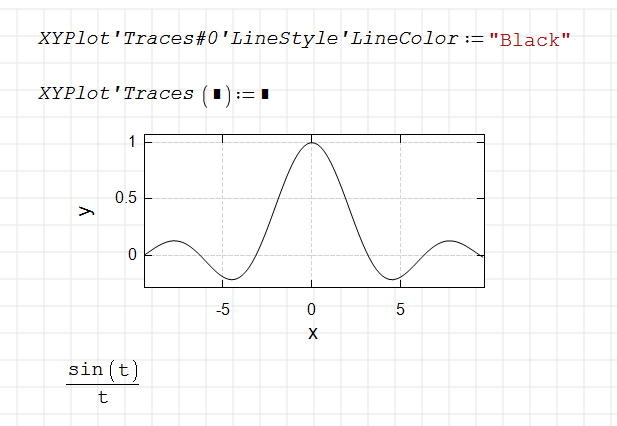
WroteI think I can adapt this syntax to customize the properties of a set of curves....
What about this notation?. And with the option for assigning a vector, like a colormap.
.Traces(,) - for all curves
.Traces(i,j) - for curves from i to j
.Traces(,j) - for curves from 0 to j
.Traces(i,) - for curves from i to end
Best regards.
Alvaro.
Отредактировано 26.07.2025 06:16:40
There will be vector support, but I don't use brackets, because it should work in different cases.
Russia ☭ forever, Viacheslav N. Mezentsev
1 пользователям понравился этот пост
Alvaro 27.07.2025 06:51:34
It's nice to combine and layer colors.

Отредактировано 26.07.2025 19:49:35
Russia ☭ forever, Viacheslav N. Mezentsev
2 пользователям понравился этот пост
I have a bug when printing. This is a result of adjusting for high DPI.

Отредактировано 26.07.2025 19:48:48
Russia ☭ forever, Viacheslav N. Mezentsev
Plugin updated. Please try.
Changes:
- fixed printing issue in GetDpiScaledFont().
Implementing the scaling function is not easy, I will spend a couple more days testing and fixing bugs.
Отредактировано 26.07.2025 19:54:14
Russia ☭ forever, Viacheslav N. Mezentsev
Plugin updated. Please try.
Changes:
- fixed issue with scaling grid label values.
I hope scaling will work properly for a while now.
Documents that were previously created at high resolution require adjustment of font size.
Отредактировано 26.07.2025 20:39:47
Russia ☭ forever, Viacheslav N. Mezentsev
3 пользователям понравился этот пост
Вячеслав Мезенцев 28.07.2025 11:21:35, francesco rapuano 28.07.2025 13:20:25, sergio 28.07.2025 19:43:31
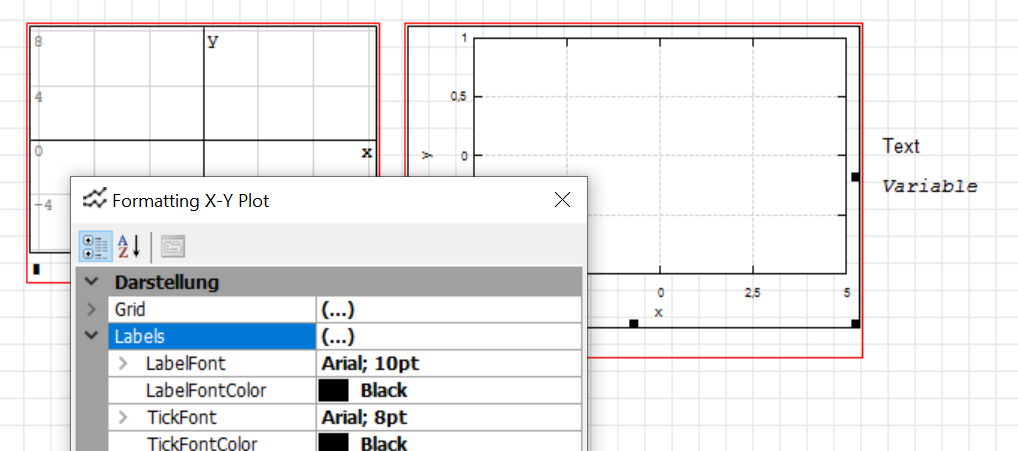
I seem to have problems with the font size in the plugin. The font sizes in the plot region and on the canvas are inconsistent.
The canvas font is set to 10. While the label font is also set to 10 in the region, the labels appear much smaller.
Edit: Meanwhile I found out the reason for the problem. If I change the hardware setup while SMath is running (e.g. switching from docking station with external monitor to just the notebook with built-in monitor) I get the problem as indicated in the screenshot. Yet, if I restart SMath, the problem is fixed.
I don't know if the plot region is supposed to handle the situation without problems but at least I have a workaround.
problem nearly fixed (now the labels are slightly too big.)
original problem
System information:
SMath Studio: SMath Studio 1.3.0.9126, 64-bit
OS: Microsoft Windows NT 10.0.19045.0; Windows 10 Pro, 64-bit
Screen: 1280x720 px, 96x96 dpi, 96 GP.CDPI
Localization: language=GER; dec.symbol=; arg.separator=; OS dec.symbol=; OS arg.separator=; OS d.g.separator=; units=ger;
Framework: CLR 4.0.30319.42000
installed versions:
v2.0.50727 2.0.50727.4927 SP2
v3.0 3.0.30729.4926 SP2
v3.5 3.5.30729.4926 SP1
v4
Client 4.8.09037
Full 4.8.09037
v4.0
Client 4.0.0.0
Plugins:
- [AppDir] AreaRegion - 1.73.9126.0
- [AppDir] HTMLFileType - 1.73.9126.0
- [AppDir] ImageFileType - 1.73.9126.0
- [AppDir] MathRegion - 1.73.9126.0
- [AppDir] PictureRegion - 1.73.9126.0
- [AppDir] PlotRegion - 1.73.9126.0
- [AppDir] SMathFileType - 1.73.9126.0
- [AppDir] SpecialFunctions - 1.73.9126.0
- [AppDir] SpecialFunctions - 1.73.9126.0
- [AppDir] StandardToolboxButtons - 1.73.9126.0
- [AppDir] TextRegion - 1.73.9126.0
- [UserDir] 3D Plot Region (Chart3DLib) - 0.1.7806.5325
- [UserDir] 3D Plot Region (Chart3DLib) - 0.1.7806.5325
- [UserDir] ALGLIB® - numerical analysis library - 1.0.8025.20709
- [UserDir] Cephes Mathematical Library - 1.0.8034.38340
- [UserDir] CheckBoxList Region - 1.0.7806.5399
- [UserDir] CheckBoxRegion - 1.0.9141.26639
- [UserDir] Combobox Region - 0.1.7806.5423
- [UserDir] ComboBoxList Region - 1.0.8763.41296
- [UserDir] Conditionally Formatted Label - 1.0.8138.35464
- [UserDir] CoolProp Wrapper - 6.4.8214.13502
- [UserDir] Custom Glyphs - 1.1.7783.42782
- [UserDir] CustomFunctions - 1.2.9201.29023
- [UserDir] Data Exchange - 1.1.7813.24580
- [UserDir] Development Tools - 1.1.7490.41956
- [UserDir] DISLIN 11.5 - 0.2.8187.36790
- [UserDir] DotNumerics - 1.1.8269.16536
- [UserDir] DSP Library - 2.0.8501.16571
- [UserDir] EXCEL (2003+) I/O with recalculation and PNG export - 2.1.8225.33551
- [UserDir] Excel Files Plugin - 1.3.7832.3161
- [UserDir] Excel Input-Output Functions - 1.1.8225.33532
- [UserDir] FEBeam - 1.0.8380.20839
- [UserDir] FFTPACK - 1.1.7563.3712
- [UserDir] FIR Filter Design - 1.0.8187.41094
- [UserDir] GPCWrapper - 1.0.9161.7296
- [UserDir] Hyperlink Region - 1.0.7806.5225
- [UserDir] Image Region - 2.100.9141.40696
- [UserDir] include - 0.2.8085.37792
- [UserDir] Maple Tools - 1.1.8665.21209
- [UserDir] Maple Tools - 1.1.8665.21209
- [UserDir] Maple Tools - 1.1.8665.21209
- [UserDir] Mathcad Custom Functions - 1.1.8035.3236
- [UserDir] Mathcad File Access Functions - 1.0.8011.30679
- [UserDir] Mathcad Toolbox - 0.5.9130.35983
- [UserDir] Mathcad Toolbox - 0.5.9130.35983
- [UserDir] Matlab Runtime Library - 1.1.8044.8489
- [UserDir] MatrixExtensions - 1.0.8302.28555
- [UserDir] MaximaPlugin - 1.98.8797.27896
- [UserDir] Memo Region - 0.2.8320.6766
- [UserDir] Modeller Region - 1.0.8763.37680
- [UserDir] Nonlinear Solvers - 1.1.7097.23301
- [UserDir] Numeric Up-Down Region - 1.0.8763.41162
- [UserDir] Octave C++ Math Library - 1.0.7871.39565
- [UserDir] PDF Files Plugin - 1.0.7097.27694
- [UserDir] Pie Chart Region - 1.0.8770.25505
- [UserDir] RadioButtonList Region - 1.0.8763.40835
- [UserDir] Run - 0.2.7786.3193
- [UserDir] SetOperations - 0.4.8992.40087
- [UserDir] Slider Region - 1.0.9041.20211
- [UserDir] SnapshotRegion - 1.1.9315.25145
- [UserDir] Statistical Tools - 1.0.9201.22240
- [UserDir] Table Region - 0.3.8770.23606
- [UserDir] Text Region Utilities - 0.4.7802.40621
- [UserDir] ViewerFileType - 1.1.9099.39268
- [UserDir] Writer Region - 0.23.8034.36139
- [UserDir] XlsxImportExport - 1.3.7845.24796
- [UserDir] XMCDFileType.dll - 1.13.8339.3084
- [UserDir] X-Y Plot Region (JXCharts) - 0.3.9338.42055
- [UserDir] X-Y Plot Region (JXCharts) - 0.3.9338.42055
- [UserDir] ZedGraph Region (ZedGraph) - 0.1.7806.5613
The canvas font is set to 10. While the label font is also set to 10 in the region, the labels appear much smaller.
Edit: Meanwhile I found out the reason for the problem. If I change the hardware setup while SMath is running (e.g. switching from docking station with external monitor to just the notebook with built-in monitor) I get the problem as indicated in the screenshot. Yet, if I restart SMath, the problem is fixed.
I don't know if the plot region is supposed to handle the situation without problems but at least I have a workaround.
problem nearly fixed (now the labels are slightly too big.)
original problem
System information:
SMath Studio: SMath Studio 1.3.0.9126, 64-bit
OS: Microsoft Windows NT 10.0.19045.0; Windows 10 Pro, 64-bit
Screen: 1280x720 px, 96x96 dpi, 96 GP.CDPI
Localization: language=GER; dec.symbol=
Framework: CLR 4.0.30319.42000
installed versions:
v2.0.50727 2.0.50727.4927 SP2
v3.0 3.0.30729.4926 SP2
v3.5 3.5.30729.4926 SP1
v4
Client 4.8.09037
Full 4.8.09037
v4.0
Client 4.0.0.0
Plugins:
- [AppDir] AreaRegion - 1.73.9126.0
- [AppDir] HTMLFileType - 1.73.9126.0
- [AppDir] ImageFileType - 1.73.9126.0
- [AppDir] MathRegion - 1.73.9126.0
- [AppDir] PictureRegion - 1.73.9126.0
- [AppDir] PlotRegion - 1.73.9126.0
- [AppDir] SMathFileType - 1.73.9126.0
- [AppDir] SpecialFunctions - 1.73.9126.0
- [AppDir] SpecialFunctions - 1.73.9126.0
- [AppDir] StandardToolboxButtons - 1.73.9126.0
- [AppDir] TextRegion - 1.73.9126.0
- [UserDir] 3D Plot Region (Chart3DLib) - 0.1.7806.5325
- [UserDir] 3D Plot Region (Chart3DLib) - 0.1.7806.5325
- [UserDir] ALGLIB® - numerical analysis library - 1.0.8025.20709
- [UserDir] Cephes Mathematical Library - 1.0.8034.38340
- [UserDir] CheckBoxList Region - 1.0.7806.5399
- [UserDir] CheckBoxRegion - 1.0.9141.26639
- [UserDir] Combobox Region - 0.1.7806.5423
- [UserDir] ComboBoxList Region - 1.0.8763.41296
- [UserDir] Conditionally Formatted Label - 1.0.8138.35464
- [UserDir] CoolProp Wrapper - 6.4.8214.13502
- [UserDir] Custom Glyphs - 1.1.7783.42782
- [UserDir] CustomFunctions - 1.2.9201.29023
- [UserDir] Data Exchange - 1.1.7813.24580
- [UserDir] Development Tools - 1.1.7490.41956
- [UserDir] DISLIN 11.5 - 0.2.8187.36790
- [UserDir] DotNumerics - 1.1.8269.16536
- [UserDir] DSP Library - 2.0.8501.16571
- [UserDir] EXCEL (2003+) I/O with recalculation and PNG export - 2.1.8225.33551
- [UserDir] Excel Files Plugin - 1.3.7832.3161
- [UserDir] Excel Input-Output Functions - 1.1.8225.33532
- [UserDir] FEBeam - 1.0.8380.20839
- [UserDir] FFTPACK - 1.1.7563.3712
- [UserDir] FIR Filter Design - 1.0.8187.41094
- [UserDir] GPCWrapper - 1.0.9161.7296
- [UserDir] Hyperlink Region - 1.0.7806.5225
- [UserDir] Image Region - 2.100.9141.40696
- [UserDir] include - 0.2.8085.37792
- [UserDir] Maple Tools - 1.1.8665.21209
- [UserDir] Maple Tools - 1.1.8665.21209
- [UserDir] Maple Tools - 1.1.8665.21209
- [UserDir] Mathcad Custom Functions - 1.1.8035.3236
- [UserDir] Mathcad File Access Functions - 1.0.8011.30679
- [UserDir] Mathcad Toolbox - 0.5.9130.35983
- [UserDir] Mathcad Toolbox - 0.5.9130.35983
- [UserDir] Matlab Runtime Library - 1.1.8044.8489
- [UserDir] MatrixExtensions - 1.0.8302.28555
- [UserDir] MaximaPlugin - 1.98.8797.27896
- [UserDir] Memo Region - 0.2.8320.6766
- [UserDir] Modeller Region - 1.0.8763.37680
- [UserDir] Nonlinear Solvers - 1.1.7097.23301
- [UserDir] Numeric Up-Down Region - 1.0.8763.41162
- [UserDir] Octave C++ Math Library - 1.0.7871.39565
- [UserDir] PDF Files Plugin - 1.0.7097.27694
- [UserDir] Pie Chart Region - 1.0.8770.25505
- [UserDir] RadioButtonList Region - 1.0.8763.40835
- [UserDir] Run - 0.2.7786.3193
- [UserDir] SetOperations - 0.4.8992.40087
- [UserDir] Slider Region - 1.0.9041.20211
- [UserDir] SnapshotRegion - 1.1.9315.25145
- [UserDir] Statistical Tools - 1.0.9201.22240
- [UserDir] Table Region - 0.3.8770.23606
- [UserDir] Text Region Utilities - 0.4.7802.40621
- [UserDir] ViewerFileType - 1.1.9099.39268
- [UserDir] Writer Region - 0.23.8034.36139
- [UserDir] XlsxImportExport - 1.3.7845.24796
- [UserDir] XMCDFileType.dll - 1.13.8339.3084
- [UserDir] X-Y Plot Region (JXCharts) - 0.3.9338.42055
- [UserDir] X-Y Plot Region (JXCharts) - 0.3.9338.42055
- [UserDir] ZedGraph Region (ZedGraph) - 0.1.7806.5613
Отредактировано 03.08.2025 21:30:48
Technische Mechanik mit SMath Studio: https://link.springer.com/book/10.1007/978-3-658-50592-9
- Новые сообщения
- Нет новых сообщений