1 страниц (10 вхождений)
Wavefunction contour plot - Сообщения
Dear all,
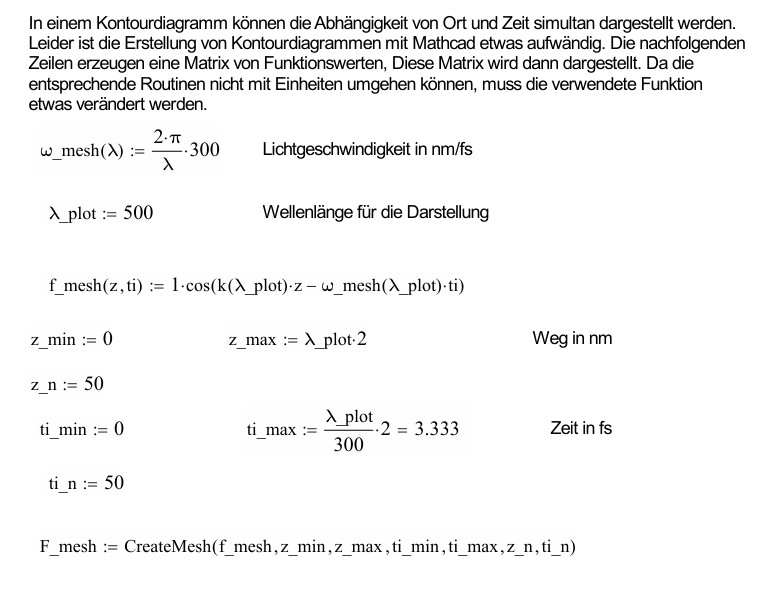
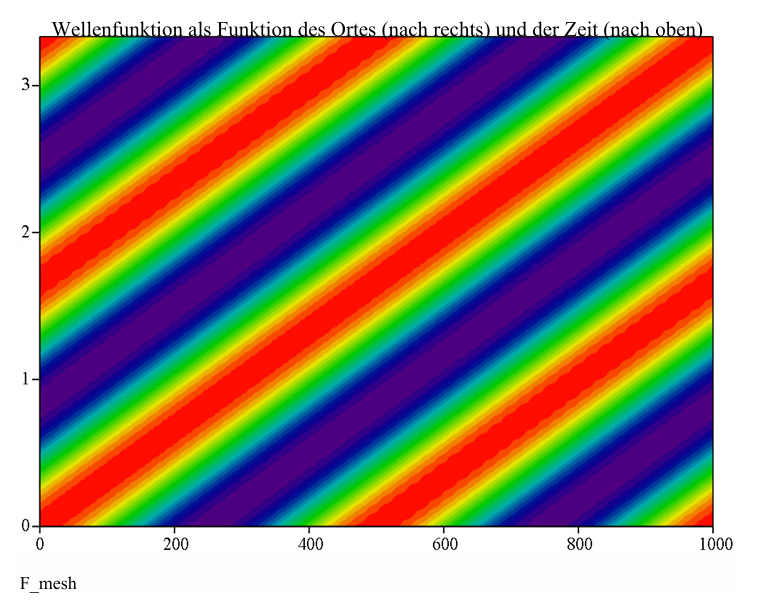
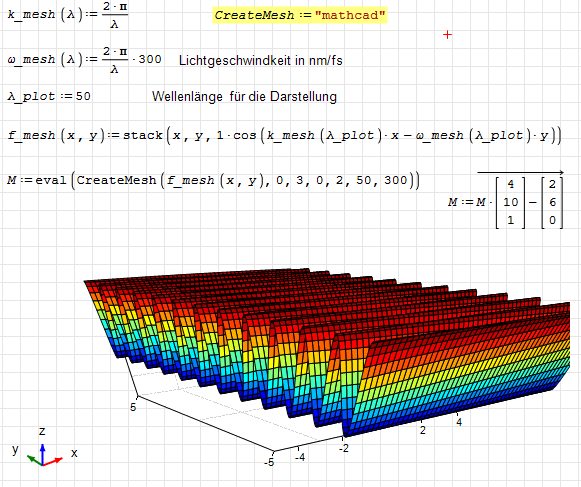
in a Mathcad file, I created a contour plot to display the dependence of place and time of the wavefunction simultaneously. In the mathcad file, I created a matrix without units (see in screenshot).
Now I would like to create this file in SMath. Unfortunately, simple copy and paste doesn't work
I have attached my own SMath file, in which I tried something out. Unfortunately, I am at a loss.
Does anyone have an idea or a helpful tip?
Thanks in advance
wavefunction.sm (11,29 КиБ) скачан 229 раз(а).
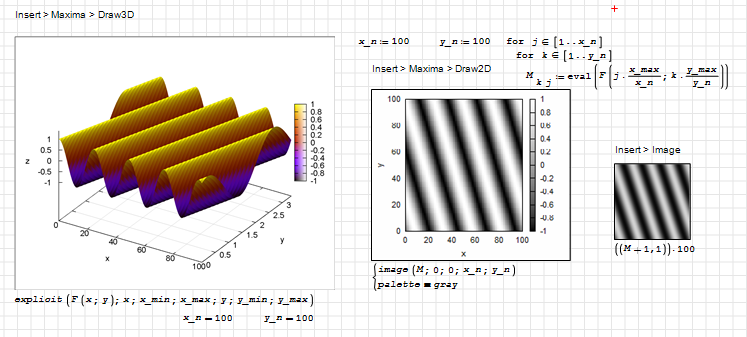
You can use the Maxima-Plugin or the image region.
Explicit 3D plotting works if the function is properly translated to Maxima. For instructions see
https://opus4.kobv.de/opus4-fhbrb/solrsearch/index/search/start/0/rows/100/sortfield/score/sortorder/desc/searchtype/simple/query/smath
wavefunction_Kr.sm (85,13 КиБ) скачан 227 раз(а).[attach]
Explicit 3D plotting works if the function is properly translated to Maxima. For instructions see
https://opus4.kobv.de/opus4-fhbrb/solrsearch/index/search/start/0/rows/100/sortfield/score/sortorder/desc/searchtype/simple/query/smath
wavefunction_Kr.sm (85,13 КиБ) скачан 227 раз(а).[attach]
Technische Mechanik mit SMath Studio: https://link.springer.com/book/10.1007/978-3-658-50592-9
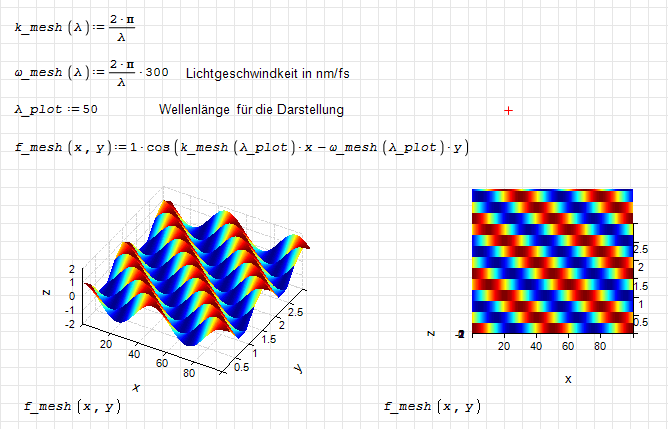
Hi. This is also another option, with the 3D plot plugin ( https://smath.com/en-US/forum/topic/vbCaKa/3D-Plot-Region ), while it has some limitations, it fulfills its purpose on many occasions.
wavefunction.sm (12,04 КиБ) скачан 225 раз(а).
Also remember that default ORIGIN in mathcad is zero, but SMath origin is one, and you can't change it.
Best regards.
Alvaro.
wavefunction.sm (12,04 КиБ) скачан 225 раз(а).
Also remember that default ORIGIN in mathcad is zero, but SMath origin is one, and you can't change it.
Best regards.
Alvaro.
THANK YOU Martin and Alvaro!
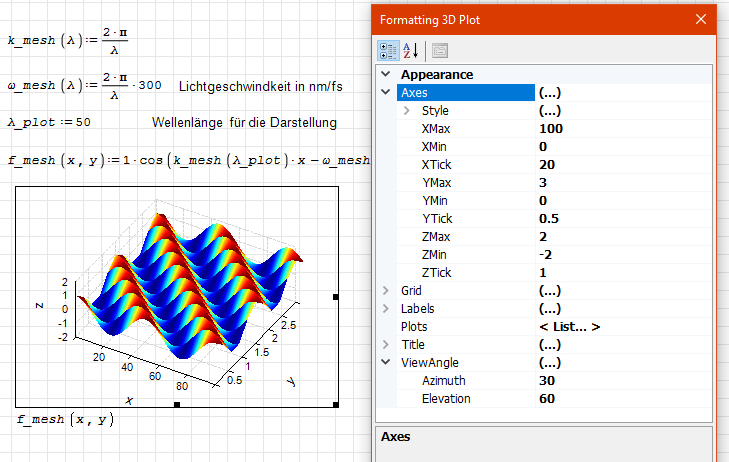
I already had the 3D plot plugin so I started with this option. However my SMath changed some settings for the plot's format and color.
Alvaro, would you please be so kind as to show me the specific settings for the plot?
I already had the 3D plot plugin so I started with this option. However my SMath changed some settings for the plot's format and color.
Alvaro, would you please be so kind as to show me the specific settings for the plot?
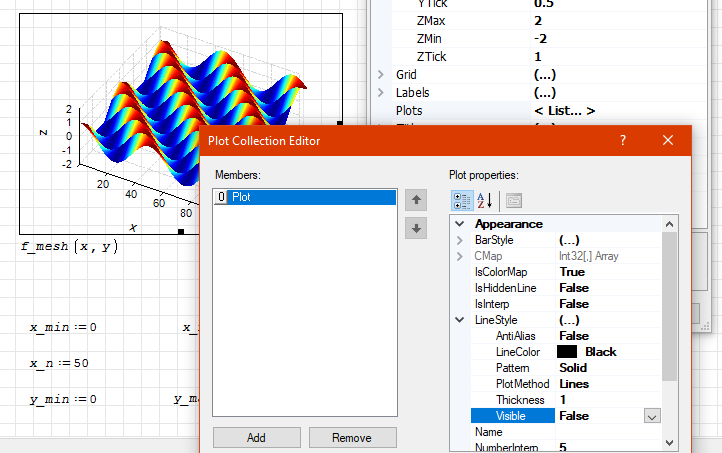
Hi. It seems that I'm using an old plugin version, which not save the plot configuration. I need to deselect "exclude beta versions" to see the update. This would be the configuration that was not saved
Best regards.
Alvaro.
Best regards.
Alvaro.
Thank you Alvaro!
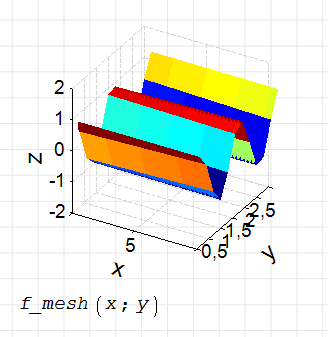
I have added your plot configurations. Sadly, it doesn't look good
I think I'll have to play around with the configurations but having the plot itself was a hugh help!
I have added your plot configurations. Sadly, it doesn't look good
I think I'll have to play around with the configurations but having the plot itself was a hugh help!
Hi. It seems that you are using the old plugin version too. Please uncheck "Exclude beta versions" from the plugin manager, and go online to verify if you have the latest version.
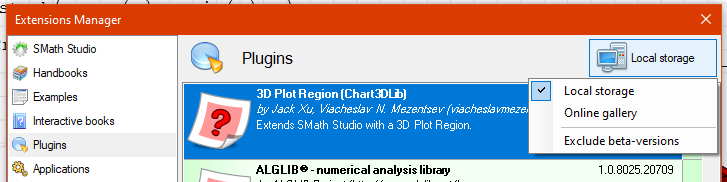
I'm not sure, but it seems to me that this version doesn't save the plot setup either. Anyway, it appears to be a much improved version compared to the previous one.
Best regards.
Alvaro.
I'm not sure, but it seems to me that this version doesn't save the plot setup either. Anyway, it appears to be a much improved version compared to the previous one.
Best regards.
Alvaro.
Thank you, Alvaro!
I downloaded the newest version. The plot looks better but nothing like your screenshot.
I think I'll have to look in my SMath settings because the plots with the maxima plugin from Martin don't look good either.
I downloaded the newest version. The plot looks better but nothing like your screenshot.
I think I'll have to look in my SMath settings because the plots with the maxima plugin from Martin don't look good either.
Hi. Please, try this workaround. It has a scale factor and an offset, useful until the plugin has the functionality to save the configuration. It should look like this when running, without any modifications.
wave.sm (8,09 КиБ) скачан 176 раз(а).
Best regards.
Alvaro.
wave.sm (8,09 КиБ) скачан 176 раз(а).
Best regards.
Alvaro.
1 пользователям понравился этот пост
Caro 22.05.2026 08:36:35

1 страниц (10 вхождений)
- Новые сообщения
- Нет новых сообщений