Iterative plotting for drawing a mesh - Сообщения
Hi all!!
I am working in a calculation that finish with a mesh from specific dimmensions and steps.
I am trying to plot this arragement without luck.
I have Lx:=50m Ly:=50m Div_x:=5 Div_y:=8
0
______________50
|__|__|__|__|__|
|__|__|__|__|__|
|__|__|__|__|__|
|__|__|__|__|__|
|__|__|__|__|__|
|__|__|__|__|__|
|__|__|__|__|__|
|__|__|__|__|__|
50
I am doing a:
for i:=1;i
but i do not know hoy to build a iterative matrix of vectos to plot.
Any ideas?
Thanks!!!
Thanks for the quick answer Jean!!
I have been play with your help, and I can plot only a square meshes.
I can't plot a rectangular mesh with different steps (in x and y).
I have been play with your help, and I can plot only a square meshes.
I can't plot a rectangular mesh with different steps (in x and y).
We are almost there!!
Look this. I can resize the mesh on Y limits.
Look this. I can resize the mesh on Y limits.
Sorry my last post must say "I can't resize the mesh on Y limits."
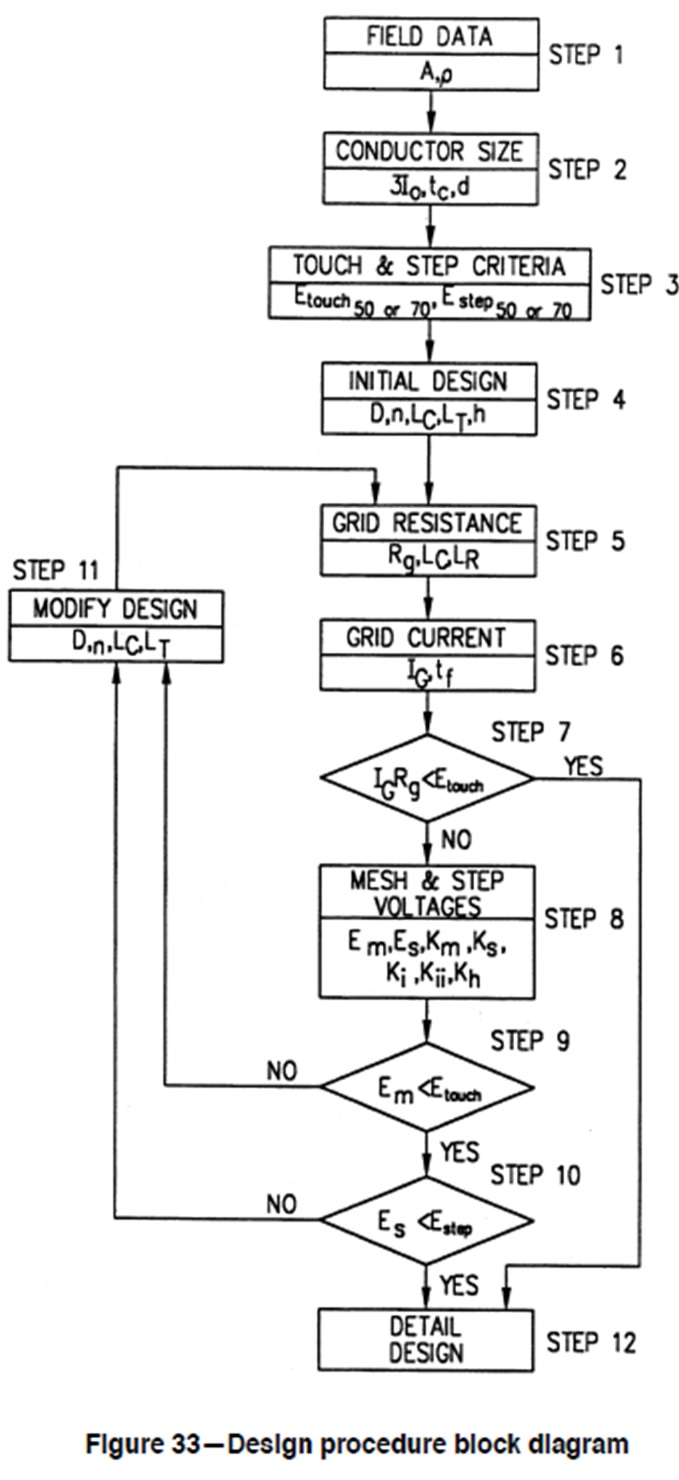
The thing I am trying to plot is the result of an electrical grounding/earthing calculation done by IEEE-80 (substation grounding).
The output of the calculation is a mesh of buried (cooper) conductors from specific dimensions and quantities.
Thanks!!!
The thing I am trying to plot is the result of an electrical grounding/earthing calculation done by IEEE-80 (substation grounding).
The output of the calculation is a mesh of buried (cooper) conductors from specific dimensions and quantities.
Thanks!!!
Thank you very much for the help Jean!! I really appreciate it!
The last post is exactly what I need to do, but... (there's always a "but")
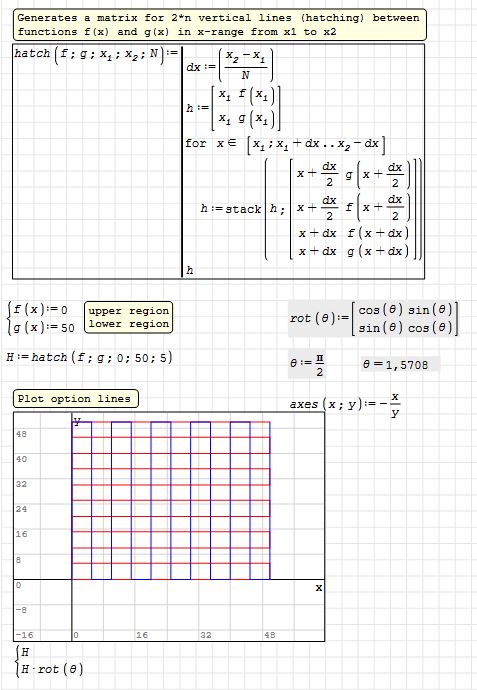
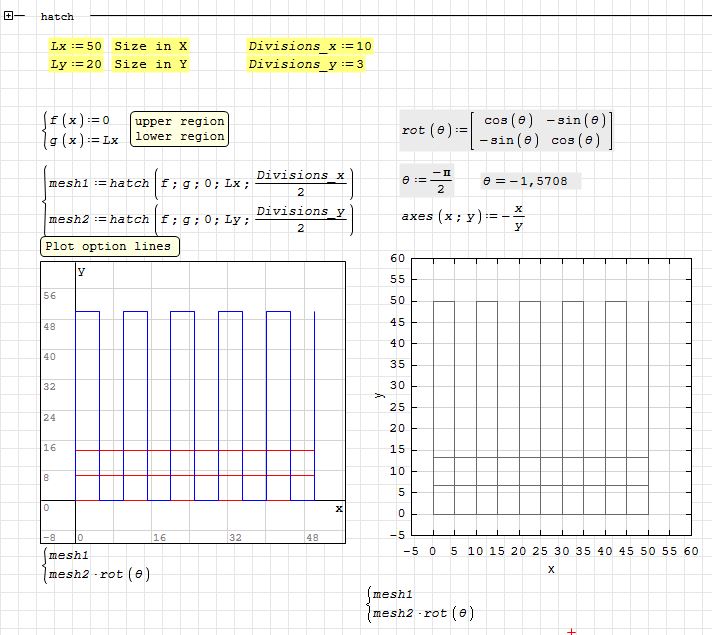
I need an way to generate the vectors matrix from:
-the total length of the mesh in X (long)
-the total length of the mesh in Y (width)
-the intermediate distances in X (step X)
-the intermediate distances in Y (step Y)
Do you think it's possible?
The last post is exactly what I need to do, but... (there's always a "but")
I need an way to generate the vectors matrix from:
-the total length of the mesh in X (long)
-the total length of the mesh in Y (width)
-the intermediate distances in X (step X)
-the intermediate distances in Y (step Y)
Do you think it's possible?
WroteI am trying to plot this arrangement without luck.
... your project attached.
2D Util Points Grid_Lines Canvas ADVANCED [Part7].sm (55,85 КиБ) скачан 771 раз(а).
Wrote... your project attached.
... slightly refreshed wrt to grid.
2D Util Points Grid_Lines Canvas ADVANCED [Part7].sm (60,77 КиБ) скачан 793 раз(а).
Amazing Jean!!
Thank you very much!! I will play with that!
Thank you very much!! I will play with that!
WroteAmazing Jean!!
Thank you very much!! I will play with that!
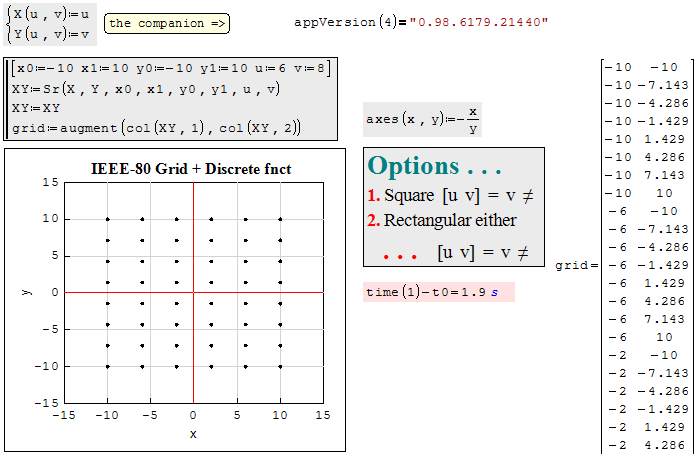
At this point of your project and for the [6 x 9],
you can put some resulting IEEE-80 maths over the plot.
As well you can change the grid size and the maths
result will follow. You will have to refresh Xtick/Ytick
spacing for convenient publishing.
Eventually, you may add a discrete plot over the grid.
If you have more suite, propose for general interest,
unless the project is confidential in some way.
That's the only profitable application of 2D Scatter.
Smath is not suited for the 3D plot, but renders as
point plots. This Scatter style was designed for Mathcad
to generate low point data set re-plotted via the
specific "Scatter plot" interpolated X,Y directions.
This version Sr(X(x,y),Y(x,y),Z(x,y),u,v) is most
interesting for plotting a uni-color family of traces
from the Smath native QuickPlot.
Jean
Utilities Matrix Create Sr(X,Y,Z,s0,s1,t0,t1,xmesh,ymesh) GaussianMultitrace.sm (21,95 КиБ) скачан 869 раз(а).
Utilities Matrix Create Sr(X,Y,Z,s0,s1,t0,t1,xmesh,ymesh) Spline_Interpolate.sm (95,14 КиБ) скачан 898 раз(а).
Hi Jean,
I can perfectly understand that Smath plot is not designed for this, but with a litte tweak can be draw a "ilustrative example" of the results.
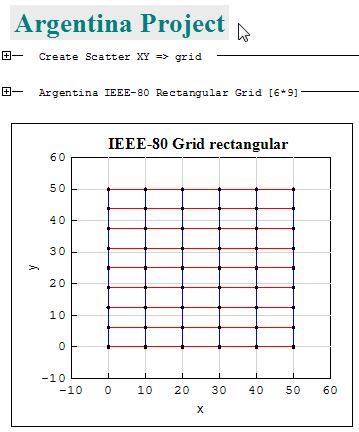
The project its not confidential, its a ground system of a new substation to expand electrical public distribution grid. Its done according the steps defined in IEEE80.
So, I am doing this as an "extra mile" of the job (because the resulting grid must be drawn in cad files, over the real installation).
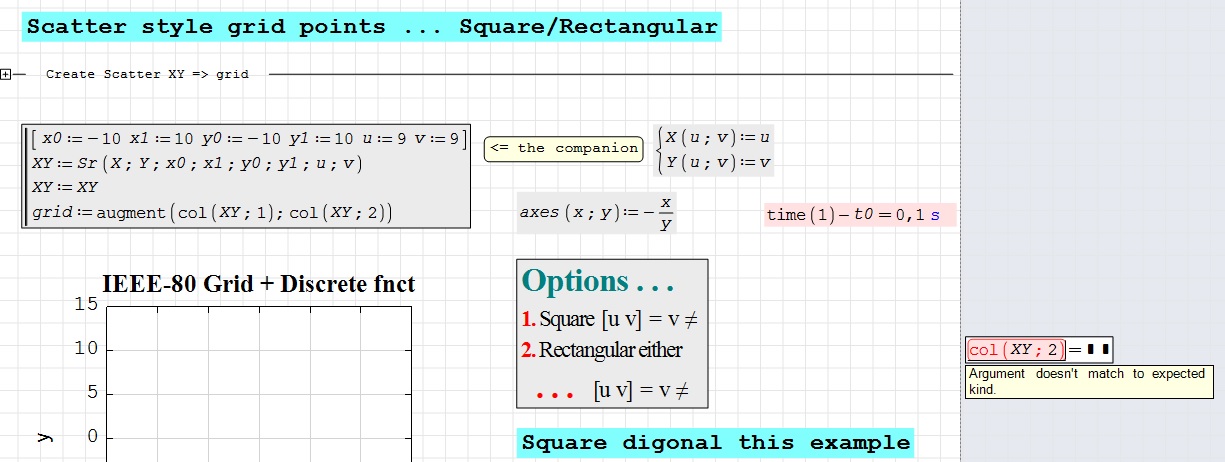
Regarding your submitted files, I can not draw the rods.
I trace the problem until this (see figure). Its seems that XY matrix has no second column. What do you think?
I can perfectly understand that Smath plot is not designed for this, but with a litte tweak can be draw a "ilustrative example" of the results.
The project its not confidential, its a ground system of a new substation to expand electrical public distribution grid. Its done according the steps defined in IEEE80.
So, I am doing this as an "extra mile" of the job (because the resulting grid must be drawn in cad files, over the real installation).
Regarding your submitted files, I can not draw the rods.
I trace the problem until this (see figure). Its seems that XY matrix has no second column. What do you think?
WroteRegarding your submitted files, I can not draw the rods.
I trace the problem until this (see figure). Its seems that XY matrix has no second column. What do you think?
If you can't plot this ... problem is your latest SS version [7109 ?]
1. Try tabulate 'grid' ... if NOT problem is there.
2. If 'grid' tabulates ... X_Y plot is freaked.
Many problems were reported about latest beta SS 7109
Some not yet attended for months.
Jean
Grid.sm (19,79 КиБ) скачан 830 раз(а).
WroteRegarding your submitted files, I can not draw the rods.
... please, attach your document,
I will check if it works in my SS 6179.
Doctors will need it anyway.
... try this + professional version [all inclusive]
Grid Pro. version.sm (19,1 КиБ) скачан 852 раз(а).
Grid Pro. version.sm (19,1 КиБ) скачан 852 раз(а).
... also: you show some maths diagram,
make sure they go below the grid system.
Jean
Argentina Project.sm (28,19 КиБ) скачан 921 раз(а).
make sure they go below the grid system.
Jean
Argentina Project.sm (28,19 КиБ) скачан 921 раз(а).
WroteIf you can't plot this ... problem is your latest SS version [7109 ?]
Yes! I am working with the last version! (I did not know it has a problem
 )
)Your last 2 examples works without problem.
Now I will check with version 6179 and tell you.
WroteIf you can't plot this ... problem is your latest SS version [7109 ?]
Yes! I am working with the last version! (I did not know it has a problem
)Your last 2 examples works without problem.
Now I will check with version 6179 and tell you.
WroteYour last 2 examples work without problem.
Now I will check with version 6179 and tell you.
The bug wrt SS 7109 is reported in Bugs & Problems small numbers.
It concerns failure to manage results < ?
The Project Fission attached turns red 7109.
The data table MeV [collapsed] is all red.
However quite correct 6179.
Electrical is not my cup of tea, rather: Process Control & Instrumentation.
I have seen that large carbon field grid under construction
next to an 800 MW Nuclear Power Plant [Same Candu in Argentina].
My understanding, next IEEE is an iterative trial/error to optimize
the best configuration of the earth ground field.
The SS 7109 bug may not reflect in this project.
May be wiser to continue SS 6179 if you still have it running.
Cheers ... Jean
Project Fission.sm (187,4 КиБ) скачан 868 раз(а).
2D Util Points Grid_Lines Canvas ADVANCED [Part7].sm (242,98 КиБ) скачан 796 раз(а).
... random list ground rods added.
I guess Smath could clean IEEE-80 pretty well.
Argentina Project.sm (218,47 КиБ) скачан 873 раз(а).
I guess Smath could clean IEEE-80 pretty well.
Argentina Project.sm (218,47 КиБ) скачан 873 раз(а).
There is a difference in plotting in versions of Smath.
Have a look to this. I am loading the same file in two differente versions of Smath (last version and last beta).
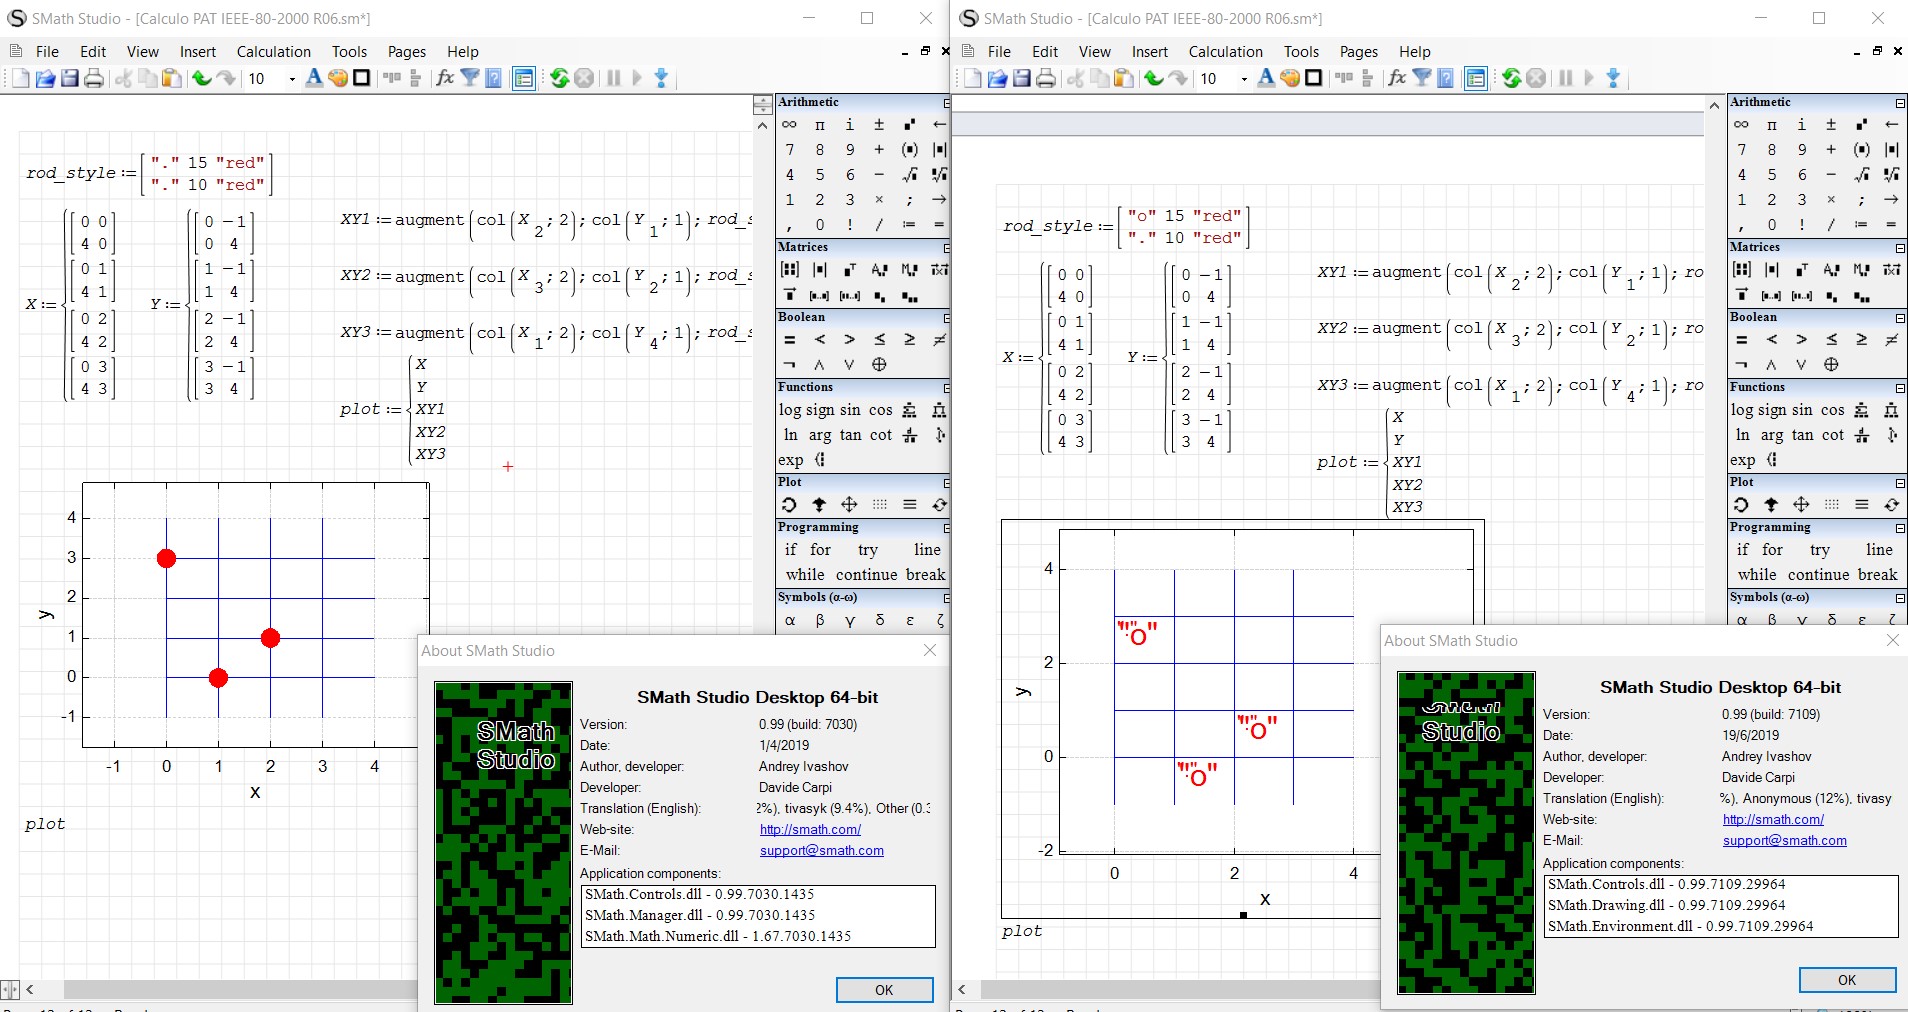
Have a look to this. I am loading the same file in two differente versions of Smath (last version and last beta).
1 пользователям понравился этот пост
Вячеслав Мезенцев 16.09.2019 15:40:00
WroteThere is a difference in plotting in versions of Smath.
By same token: you can delete lot of the previous stuff that has no more meaning wrt the mesh-line/points project. Only YOU can delete your own.
There is no difference in plotting.
The text style always plots shifted below and right.
This is a delightful Smath feature.
Eventually, you can put it wherever you want [last part of the attached].
This document is an exceptional collection of the for-loop counter.
The for-loop counter enhances Smath from low classroom
to most advanced Engineering/Scientific applications.
Largely augmented SS 6179 for what it worth ... ?
Cheers ... Jean ... Please: don't hesitate for +
2D Util Points Grid_Lines Canvas ADVANCED [Part7] IEEE-80.sm (282,84 КиБ) скачан 769 раз(а).
- Новые сообщения
- Нет новых сообщений