1 страниц (13 вхождений)
function plot in range - Сообщения
Hi All,
Could you direct me how to plot the function for some range?
plot in range.sm (5,55 КиБ) скачан 1001 раз(а).
Best regards,
Astroneus
Could you direct me how to plot the function for some range?
plot in range.sm (5,55 КиБ) скачан 1001 раз(а).
Best regards,
Astroneus

X_Y plots f(x,y)
Hi,
It looks like that both solution are not what I want to get - especially the first one...
Is there any possibility simply to plot the chart where on Y-axis I simply put the a(t) and on x-axis time??? Because this what you proposed it looks tricky and there is necessity to control units. Therefore it is not intuitive ( at least for me ;P )
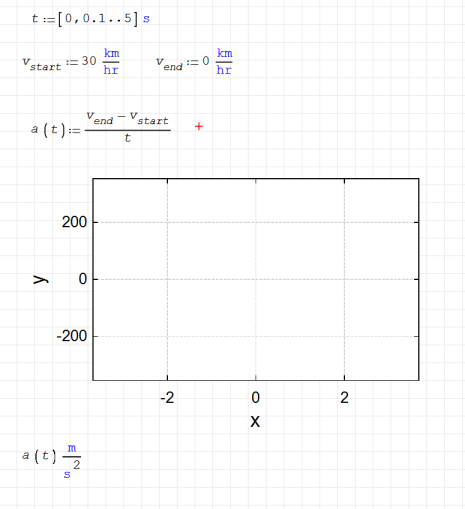
Please check the photo below made by ptc mathcad. This what I want to do, is to write the same as the function and plot it using the SMath.
Regards,
Mateusz
It looks like that both solution are not what I want to get - especially the first one...
Is there any possibility simply to plot the chart where on Y-axis I simply put the a(t) and on x-axis time??? Because this what you proposed it looks tricky and there is necessity to control units. Therefore it is not intuitive ( at least for me ;P )
Please check the photo below made by ptc mathcad. This what I want to do, is to write the same as the function and plot it using the SMath.
Regards,
Mateusz
In your conditions, only the speed and deceleration time are set.
Therefore a =const.Perhaps there are additional conditions
which you are not reporting.

Therefore a =const.Perhaps there are additional conditions
which you are not reporting.
WrotePlease check the photo below made by ptc mathcad. This what I want to do, is to write the same as the function and plot it using the SMath.
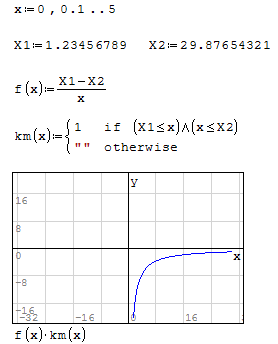
If that plot is what you need, here is your answer.
With function, dots for values and new axes grid {0.05, -2}.
Regards
plotting_range.sm (10,98 КиБ) скачан 960 раз(а).
Hi Ber7,
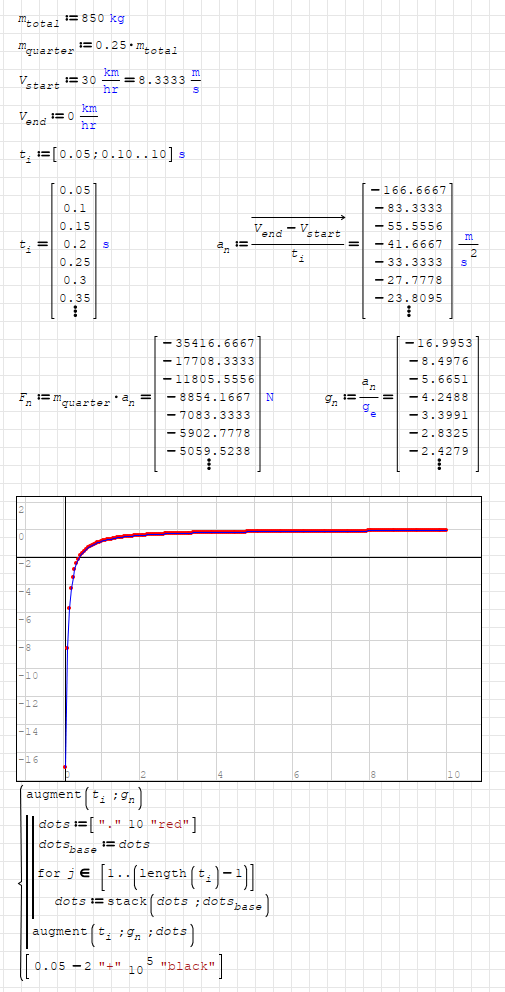
This the acceleration during the breaking from 30km/h to zero in linear movement. Therefore in fact there is a(t)= v(t)/t. So: a_i= v_i / t_i and this is function where t is in some range, and i is the iterative change of time ie. the position of specific time. This what you wrote, is not the function of acceleration versus time.
Regards,
Mateusz
@ Jean Giraud and @overload Thank you !
This is what I wanted to write in SMath!
Mateusz
This is what I wanted to write in SMath!
Mateusz
Wrotethis is function where t is in some range
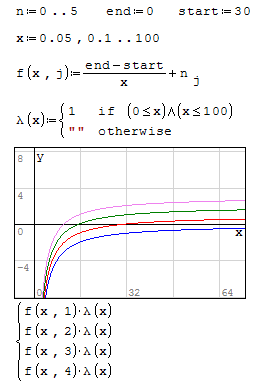
Make your deceleration as you wish from a pre-selected vector 'a'.
WroteThis is what I wanted to write in SMath !
Differently convenient plot ...
plotting_range [1].sm (11,48 КиБ) скачан 807 раз(а).
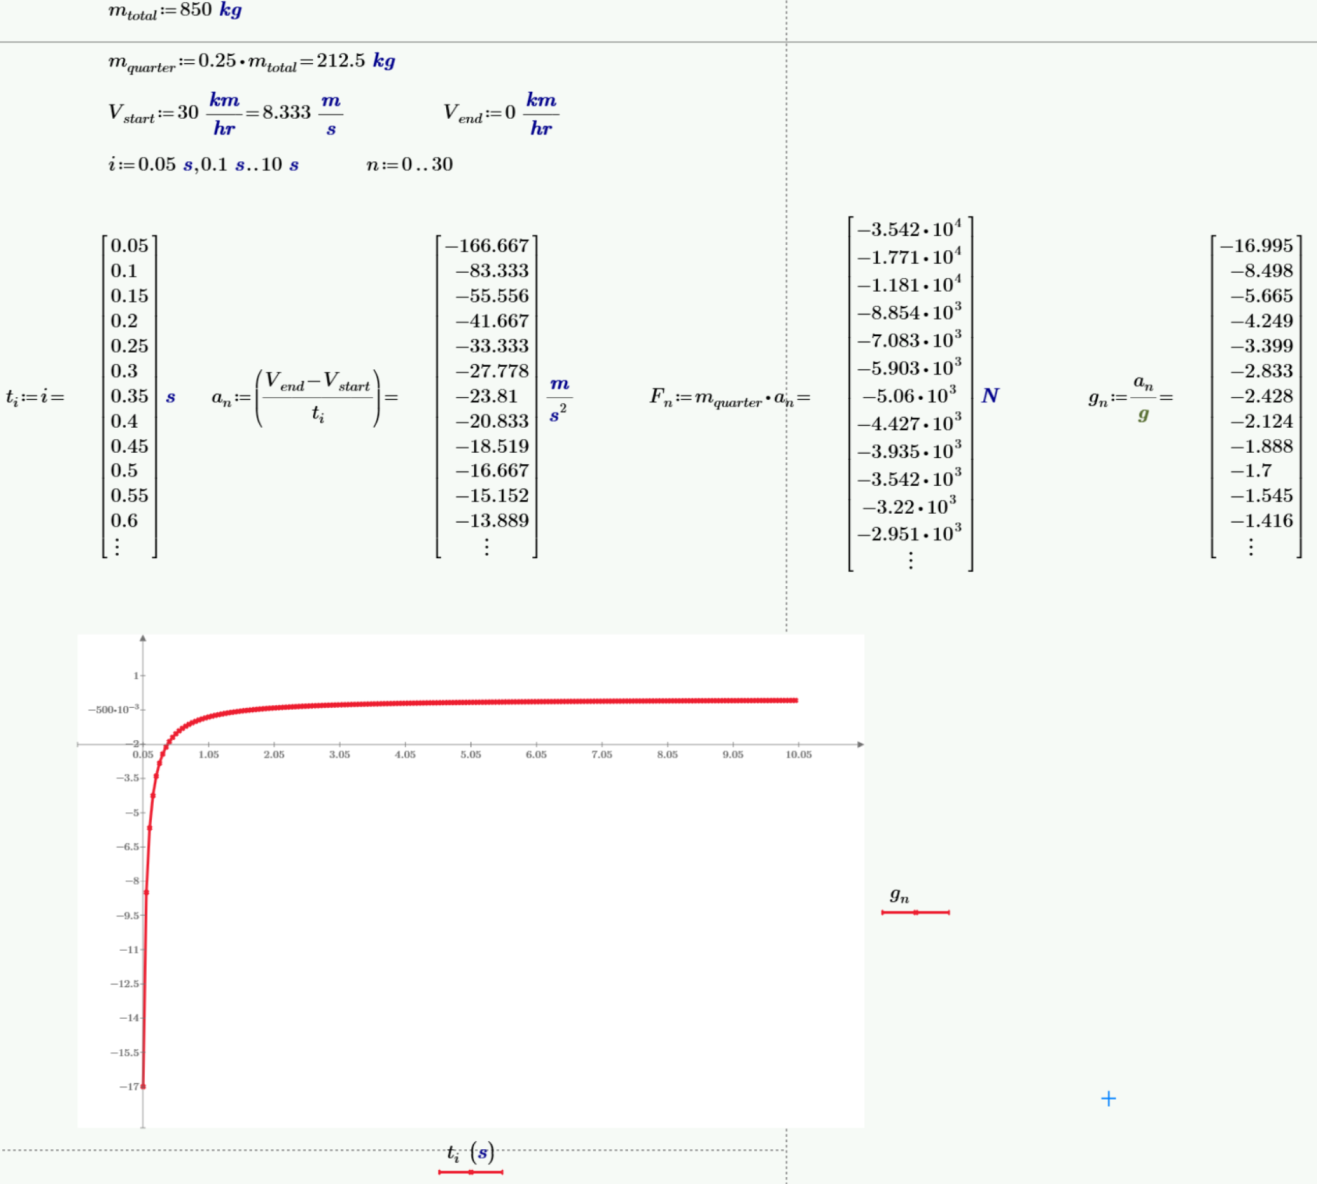
Hi. I agree with Ber7 that in absence of any other information the deceleration is constant. Physically that's means that the force of the breaks is constant too, which seems to be a good approximation, neglecting friction forces and some torque considerations about the wheels.
Yes it is: a(t) = constant for t in the interval 0 .. 10 s.
Best regards.
Alvaro.
WroteHi Ber7,
This the acceleration during the breaking from 30km/h to zero in linear movement. Therefore in fact there is a(t)= v(t)/t. So: a_i= v_i / t_i and this is function where t is in some range, and i is the iterative change of time ie. the position of specific time. This what you wrote, is not the function of acceleration versus time.
Regards,
Mateusz
Yes it is: a(t) = constant for t in the interval 0 .. 10 s.
Best regards.
Alvaro.
Wrote@ Jean Giraud and @ overlord Thank you !
This is what I wanted to write in SMath!
At this point, we can populate conveniently
then, pass Thiele continued fraction
and inspect for the first/2nd derivative.
I doubt you can do that in Mathcad/PTC
Cheers ... Jean
1 страниц (13 вхождений)
- Новые сообщения
- Нет новых сообщений