1 страниц (14 вхождений)
Does not output the value of a variable - Does not output the value of a variable - Сообщения
I'm trying to plot a graph for my task, but I can't output the values for M(s) at the end - complains about "not a square matrix". The graph is also not being built. Can anyone help with plotting and explaining how to output the value of M(s)?
It turned out to output the value of M(s) only with an arrow at the top, but the graph with the scales M(s) and ω(s) is not being built. Could you help me pls?
There are no problems in mathcad.
1.sm (13,54 КиБ) скачан 1073 раз(а).
It turned out to output the value of M(s) only with an arrow at the top, but the graph with the scales M(s) and ω(s) is not being built. Could you help me pls?
There are no problems in mathcad.
1.sm (13,54 КиБ) скачан 1073 раз(а).
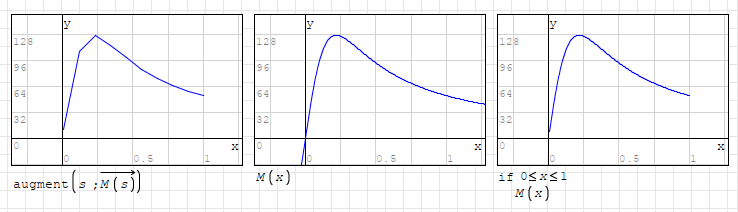
If you just wrote M(s) then your plot doesn't have enough points.
Both x and y points should be written if you are plotting them.
You can achieve this by augmenting x and y points.
Or you can plot directly by M(x) which plot region will use x for x values.
Result of your M() function will be used for y values.
You can limit plotting by simple if() or cases() function.
Regards
1.sm (15,43 КиБ) скачан 1115 раз(а).
1 пользователям понравился этот пост
TopUser2000 15.02.2023 04:43:00
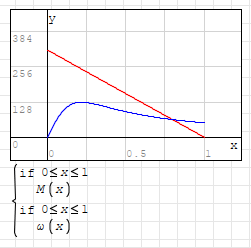
You can combine your functions by using sys().
Here is you plot completed.
Regards
Here is you plot completed.
Regards
WroteIf you just wrote M(s) then your plot doesn't have enough points.
Both x and y points should be written if you are plotting them.
You can achieve this by augmenting x and y points.
Or you can plot directly by M(x) which plot region will use x for x values.
Result of your M() function will be used for y values.
You can limit plotting by simple if() or cases() function.
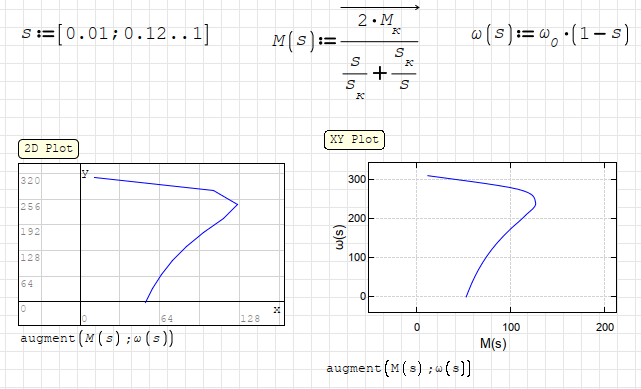
I need the folowing graph).
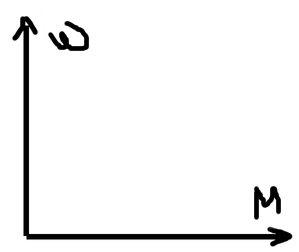
Thank you for the answers.
How I see it: I have ten values of M(s) and ω(s) and I need a graph where the Y axis is ω and X is M . I don't understand why the graph is not being plotted in this case. After all, there is everything for plotting. I posted an example in a file.
Why can't I just output the value of M(s), and for this I need to output this value with an arrow at the top?
1.sm (14,81 КиБ) скачан 1129 раз(а).
And I have mathcad example:
Meh_Har_AD.xmcd (81,1 КиБ) скачан 1092 раз(а).
Wrote... more scalar maths added.
Sorry but your variant is too difficult for me)
![2023-02-15 07_56_35-SMath Solver - [1.sm_].png](/ru-RU/files/Download/D7bkMV/2023-02-15-07_56_35-SMath-Solver---[1.sm_].png)
Technische Mechanik mit SMath Studio: https://link.springer.com/book/10.1007/978-3-658-50592-9
1 пользователям понравился этот пост
TopUser2000 15.02.2023 04:33:00
Wrotepicture
Oh, thanks friend). That's what I need.
can someone explain to me why I have to use a vector quantity when outputting the value of M(s)? Otherwise, Smath complains about a non-square matrix.
And can I rename the axes on the graph? Write ω instead of Y, and write M instead of X?
WroteWrotepicture
Oh, thanks friend). That's what I need.
can someone explain to me why I have to use a vector quantity when outputting the value of M(s)? Otherwise, Smath complains about a non-square matrix.
And can I rename the axes on the graph? Write ω instead of Y, and write M instead of X?
The vectorize function enforces elementwise operation if vector valued variables are involved.
The linear operation defining omega is elementwise by default, whereas dividing by s would be understood as a matrix operation (inversion) by default.
Modifying axes labels is only possible in other plot regions like X-Y plot plugin.
Technische Mechanik mit SMath Studio: https://link.springer.com/book/10.1007/978-3-658-50592-9
Wrotewhereas dividing by s would be understood as a matrix operation (inversion) by default.
Can I make it clear to the program that I don't have a matrix inversion and do without vectors?
I tried to install this plugin, but I still didn't figure out how to rename the axes
WroteCan I make it clear to the program that I don't have a matrix inversion and do without vectors?
If you don't vectorize() you are doing a matrix operation (inversion).
When s (vector/range) dividing 2*M.k or s.k, you are actually multiplying it with 1/s.
This is matrix inversion. Mathcad knows this and automatically vectorize function.
SMath doesn't and it is designed this way deliberately.
WroteI tried to install this plugin, but I still didn't figure out how to rename the axes
Double click to XY Plot canvas, it will open a new window for you to change its setting.
You can also Right click>Format to plot area, it will do the same as double clicking.
There you can find a section Labels. Change x-y labels to M(s) and ω(s).
XY Plot contains a lot of options there. Check them and try them.
Regards
1.sm (16,51 КиБ) скачан 1109 раз(а).
PS: If you don't want to use vectorize in your plot, you can use it your function.
1 пользователям понравился этот пост
TopUser2000 16.02.2023 03:30:00
Wrote
Regards
Thanks for full explanations :-)
WroteThanks for full explanations
SMath and Mathcad are mostly similar.
But There are also some differences.
Ask forum anytime you are struggling.
There will be a user answer it, correctly.
Regards
1 пользователям понравился этот пост
TopUser2000 23.02.2023 13:01:00
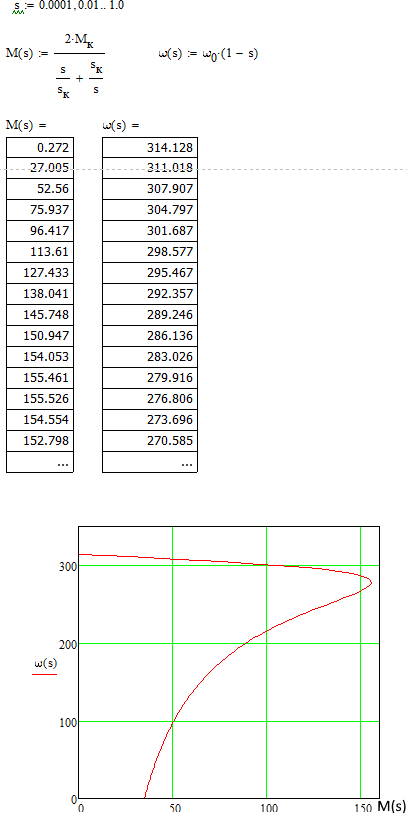
Vectorize-free versions, one with range indices and one with parametric plot.
![2023-02-16 21_50_43-SMath Solver - [1_Kr.sm_].png](/ru-RU/files/Download/wrV8zS/2023-02-16-21_50_43-SMath-Solver---[1_Kr.sm_].png)
1_Kr.sm (30,92 КиБ) скачан 1095 раз(а).
1_Kr.sm (30,92 КиБ) скачан 1095 раз(а).
Technische Mechanik mit SMath Studio: https://link.springer.com/book/10.1007/978-3-658-50592-9
2 пользователям понравился этот пост
... re-installed FindIdx(■,■,■)
too gorgeous for this application.
1 Doctored.sm (34,03 КиБ) скачан 1096 раз(а).
too gorgeous for this application.
1 Doctored.sm (34,03 КиБ) скачан 1096 раз(а).
1 пользователям понравился этот пост
TopUser2000 23.02.2023 13:01:00
Thanks for sharing your project, though no abstract to explain.
Part 1 is voluminous for advanced exploring.
Be patient for the animation to resume.
Cheers ... Jean.
TopUser2000 Copy.sm (89,1 КиБ) скачан 1083 раз(а).
Part 1 is voluminous for advanced exploring.
Be patient for the animation to resume.
Cheers ... Jean.
TopUser2000 Copy.sm (89,1 КиБ) скачан 1083 раз(а).
1 пользователям понравился этот пост
TopUser2000 23.02.2023 13:01:00
1 страниц (14 вхождений)
- Новые сообщения
- Нет новых сообщений