2-D graph is off-by-one - Сообщения
WroteI assume you are using plot 2D.
Yes, you are quite right. Sorry for being forgetful
 - off-by-1.sm (5,53 КиБ) скачан 1150 раз(а).
WroteMike, in lieu of screen shot, usse appVersion
Thanks again! I still hasn't quite got used to this new handy feature.
WroteMike, how did you zoom in?
Entered the graph, then used Ctrl+Wheel (vertical zoom) / Shift+Wheel (horizontal zoom) while keeping mouse over the graph.
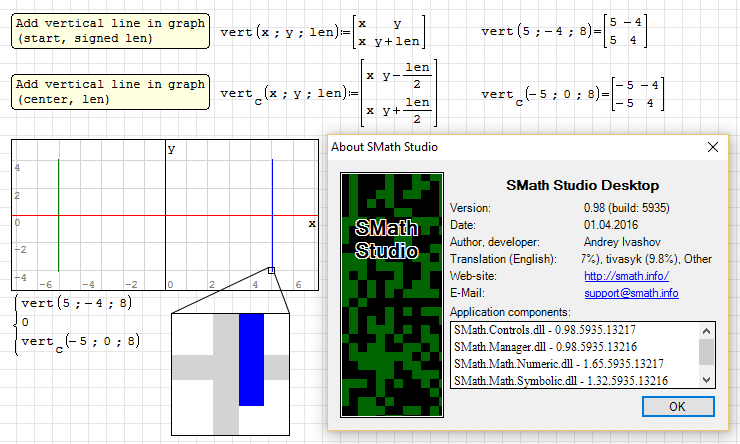
I just redid an old Gateway laptop ... Linux Mint 17.3 and Windows Vista 32 bit. Your file and my file are identical in the graphics ... when I zoom in, the "line" is clearly over the grid. Look at the zoomed in graph 2D Graph.smz (3,11 КиБ) скачан 1150 раз(а).
BTW, thanks for showing me that the descriptor can be moved. Still figuring out how to do it right as I did it by double clicking on the right edge. Sometimes it goes to the right, others to the left ...
WroteIt's a zoom graphics issue. If you zoom into the axis, the "Line" is right over the grid line
I just redid an old Gateway laptop ... Linux Mint 17.3 and Windows Vista 32 bit. Your file and my file are identical in the graphics ... when I zoom in, the "line" is clearly over the grid. Look at the zoomed in graph
No, looking at zoomed graph, and enlarging screenshot, I still see the offset.
Wrote... the descriptor can be moved. Still figuring out how to do it right as I did it by double clicking on the right edge. Sometimes it goes to the right, others to the left ...
When you enter the descriptor, it shows three vertical dots to the left. You may grab these and move horisontally.
If Smath canvas and screen display dont coincide, there is
at max +/- one pixel OFF. In Mathcad +/- ½ pica OFF.
Trust me, I checked: no pixel OFF in this demo. The OFF
pixel also appears on horizontal grid for same reason,
two flutes playing +/- ½ tune off each other.
Jean
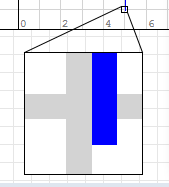
The image was not properly stretched, 123 pixels for 5 intervals.
Now, stretches back [very delicate] down to 120 pixels, then the maths
120/5 = 24 ... 4*24 = 96
A Windows screen is 96 ppi [pixels per inch], both Smath canvas and
Windows screen do coincide 1/1 and the vertical lines seat exactly
on the top of the grid lines. Years ago, there was an IBM PC 105 ppi.
The IPAD is/was 250 ppi, thus looking so nice. The IPHONE is/was 350 ppi.
Check that to update your knowledge and look "savant" to your friends.
Not beeing so minutious, there may be +/- [1] pixel OFF.
I have no idea about the screen resolution in medical/dentistry, >> 96 ppi.
The resolution of the human eye is normalised 1200 ppi.
Hi PRO cameras may have several times the human eye resolution. What counts
when purchasing camera is the resolution, not the monster pixels. None of
the low cost camera mention "ppi". Years years ago my sister had the most
perfect photo in the world or at least one of the best, from Russia.
All that matters when it comes to HD TV. Only recent documentaries photos
can fill the screen TV. Most of that commercial stuff is BS [bull shit].
Otherwise, extrapolated pixels are invented pixels, can't create what does
exist, do you ?
Jean
WroteEntered the graph, then used Ctrl+Wheel (vertical zoom) / Shift+Wheel (horizontal zoom) while keeping mouse over the graph.
I was talking about the "zoom in" to the grid/line that shows the "Pixel delta"
 . The CRTL+Wheel just changes the scale on the graph.
2D Graph.sm (7,64 КиБ) скачан 1124 раз(а).
Looks like it depends on the computer ...My work computer shows the offset
Stand corrected:
Wrote... explain more about the image vertical lines:
The image was not properly stretched,...Jean
I stretched my zoomed in graph to the right ... the "pixilation" went away. This explains why my full graph did not show the pixilation issue ...
Jean, Thank you for explaining what was going on.

Actually, I just used Paint.Net to zoom in, then made another printscreen and combined. A bit of magic
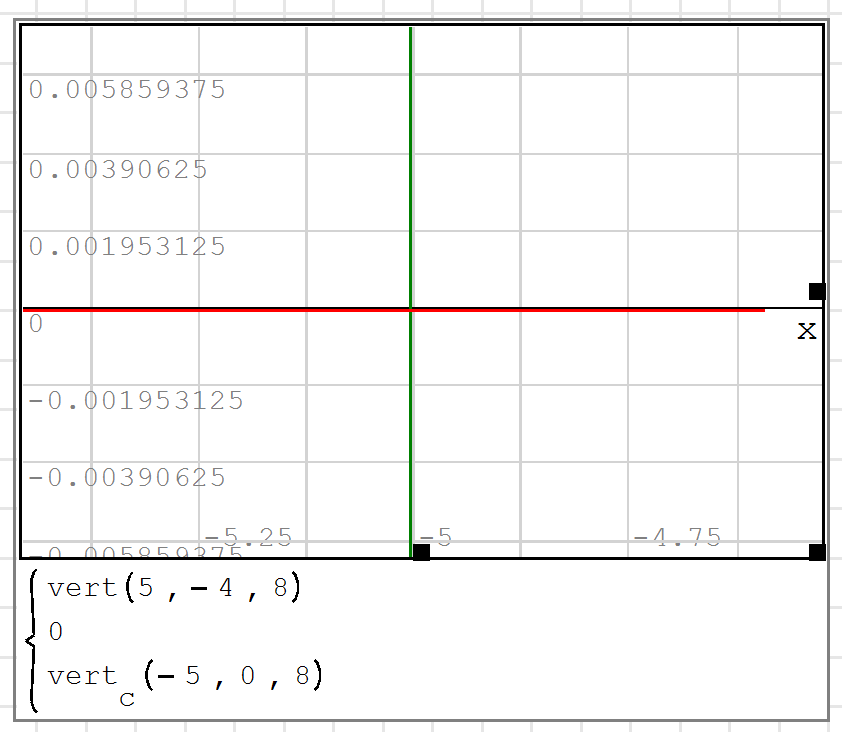
From what I can tell, the error is in the "arrow" size ("20" )[Change the arrow to an x and it shows the same error]. If I make it 1, it appears to hit the right number. This would need to be fixed as it "shows" the wrong location.
The only way to make it "look" correct, so far, is to use a "+" sign.
There is a lot in graphic package. OriginLab rates top to me. Mathematica is not bad. Both are pixel by pixel
adjustable, like Smath. Some extra features would be nice in Smath but it is viable as such and so quick.
The Maxima X_Y plot complements nicely the Smath Quick plot. Read more from Mathematica but don't drop dead !
1.9.2 Special Topic: How Graphics Are Output
The details of how Mathematica outputs graphics vary between different computer systems and different Mathematica interfaces. The documentation that came with your copy of Mathematica should tell you what is relevant in your case.
With textbased Mathematica interfaces, each piece of graphics output typically fills your complete screen, or causes a new window to be created which is then filled with graphics. The details of how you get rid of the graphics vary from one system to another. Note that when you start Mathematica with a textbased interface, you may have to load a Mathematica package to tell Mathematica how you want graphics output to be done. The details of this should be described in the documentation that came with your copy of Mathematica.
With a notebookbased Mathematica interface, each piece of graphics is placed in a cell in your notebook. The Mathematica front end allows you to manipulate the graphics in several ways, for example by resizing them, or redisplaying them with different options.
Many Mathematica systems allow you to collect together sequences of graphic images and display them in quick succession to produce an animated “movie”. Notebookbased interfaces typically allow you to select a sequence of cells to serve as the frames in your animation. Many textbased interfaces also provide animation capabilities; typically the function ShowAnimation[aa, a, … a], where the a are pieces of graphics output, generates a movie.
You should understand that when Mathematica produces any kind of graphics output, it does so in three stages. The first stage is to execute commands like Plot to produce a sequence of Mathematica graphics primitives. These primitives, to be discussed in Section 2.9, represent objects such as lines, points and polygons as Mathematica expressions. The second stage of producing graphics output is to convert these graphics primitives to a standardized deviceindependent representation of your graphical image. Mathematica generates this representation in the PostScript page description language.
The final stage of graphics output is to take the PostScript description of a graphical image, and render it on the particular device you want. In a notebookbased interface, the Mathematica front end performs this rendering. On other systems, the rendering is usually done by an external program which is automatically called from within Mathematica.
The importance of using PostScript as a graphics description language is that it can be rendered on many different kinds of devices, including both displays and printers, and it can be imported into many kinds of programs. Specific versions of Mathematica come with various conversion utilities to produce Encapsulated PostScript form, and other standard graphics formats.
With textbased Mathematica interfaces, the command PSPrint[graphics] is typically set up to print a piece of graphics. The command Display["file", graphics, "EPS"] saves the encapsulated PostScript representation of the graphics in a file.
Although most graphics from Mathematica are first converted to PostScript, and then rendered on particular devices, there are some cases where it is more convenient to render directly from the original Mathematica form. One example is on systems that manipulate images of threedimensional objects in real time. On such systems, the function Live[graphics] is typically set up to produce a “live” version of a piece of Mathematica graphics, which can then be manipulated directly using the various tools available on the particular computer system.
Cheers, Jean.
WroteI think this would be a second example. I've tried to stretch and zoom in as feasible.Graphics off.sm (3,96 КиБ) скачан 1102 раз(а).
From what I can tell, the error is in the "arrow" size ("20" )[Change the arrow to an x and it shows the same error]. If I make it 1, it appears to hit the right number. This would need to be fixed as it "shows" the wrong location.
The only way to make it "look" correct, so far, is to use a "+" sign.
Coincidence that appears in any system. The only symbols that will "center"
on a plot trace are:
(X,Y,".",size,"color")
(X,Y,"o",size,"color")
(X,Y,"+",size,"color")
Jean
As long as in any way you stretche the graph canvas
and the grid 1.125 is present:
the triplet trace/XY grid/symbol will coincide.
Jean

WroteThere is no issue in there, just plotting coincidence wrt graphic package.
Coincidence that appears in any system. The only symbols that will "center"
on a plot trace are:
(X,Y,".",size,"color")
(X,Y,"o",size,"color")
(X,Y,"+",size,"color")
Jean
Correct; also, you can use "*" and "x" (wiki: https://smath.com/wiki/Graphs.ashx#SpecialPlots)
Цитата
- Special characters (case sensitive) have position fixed on center on the given coordinates: + . * o x;
- Words, phrases or non-special characters have top-left corner of (virtual) textbox fixed on the given coordinates;

WroteЦитата
- Words, phrases or non-special characters have top-left corner of (virtual) textbox fixed on the given coordinates;
WroteBeing able to do the "arrow" or the "less than" symbol would have been nice.
Too many gadgets is like not enough. Make a nice arrow in Paint, slide the plot over the arrow.
Jean
- Новые сообщения
- Нет новых сообщений