1 страниц (7 вхождений)
Error when trying to plot the shear diagram - Сообщения
Good morning,
I'm new to smart studio and I'm trying to plot the graph for this function of a bi-supported beam but I can't
whyplot.sm (7,98 КиБ) скачан 979 раз(а).

I'm new to smart studio and I'm trying to plot the graph for this function of a bi-supported beam but I can't
whyplot.sm (7,98 КиБ) скачан 979 раз(а).

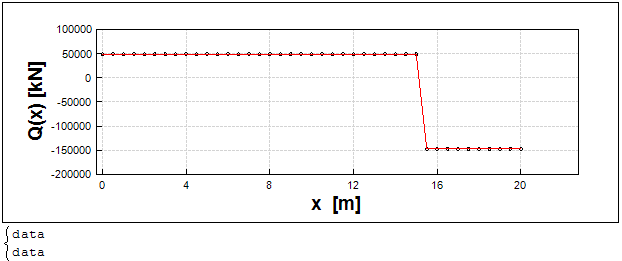
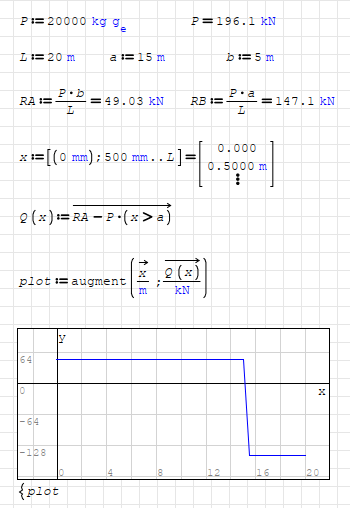
Something like that. The X-Y Plot plugin doesn't have advanced capabilities for working with units.
Unlike Mathcad, we have only one field for describing the graph. For this reason, we can only learn about the X variable from this description. For this, it must be undefined. The component looks for undefined variables in the expression and uses them to determine how to plot a graph. If you define the variable x, then the component will not understand how to plot the graph. The tilde sign (~) helps him with this as an analogue of the range variable in Mathcad.
whyplot (uni).sm (9,75 КиБ) скачан 1013 раз(а).

You have an incorrectly written expression:

We usually plot the graph like this:

Links:
1. X-Y Plot. Support for parametric plot type.
Unlike Mathcad, we have only one field for describing the graph. For this reason, we can only learn about the X variable from this description. For this, it must be undefined. The component looks for undefined variables in the expression and uses them to determine how to plot a graph. If you define the variable x, then the component will not understand how to plot the graph. The tilde sign (~) helps him with this as an analogue of the range variable in Mathcad.
whyplot (uni).sm (9,75 КиБ) скачан 1013 раз(а).
You have an incorrectly written expression:
We usually plot the graph like this:
Links:
1. X-Y Plot. Support for parametric plot type.
Russia ☭ forever, Viacheslav N. Mezentsev
WroteI'm new to smart studio and I'm trying to plot the graph for this function of a bi-supported beam but I can't
Zap units for the plot.
whyplot (else).sm (13,03 КиБ) скачан 1048 раз(а).
WroteZap units for the plot.
... add meaning to the plot.
WroteWe usually plot the graph like this:
Same approach with embedded 2D plot.
WroteThe tilde sign (~) helps him with this as an analogue of the range variable in Mathcad.
This would be awesome if 2D plot supports tilde sign (~) ranges.
Regards
In general, it is possible to make a component with two and more fields. But this situation happened historically. Ten years ago there was no experience in creating such components, and now there is no time and effort to create everything from scratch. The API allows you to add any number of such fields, but this is more difficult to program. In a sense, this is a different ideology. If we ever have a development team, they will develop a component that is more understandable to use.
Russia ☭ forever, Viacheslav N. Mezentsev
thx all closed topic
1 страниц (7 вхождений)
- Новые сообщения
- Нет новых сообщений