Find rows of matrix - Boolian Test - Сообщения

I cannot figure out how to use findrows for this. If my text expression is max(M) it works fine, but
the ≤ test does not work for me.

An example would be much appreciated.


Thanks; however, I don’t understand the large numbers in your answer, which are greater than the size of the matrix.
Sorry for my lack of understanding.

WroteNdtma,
Thanks; however, I don’t understand the large numbers in your answer, which are greater than the size of the matrix.
Sorry for my lack of understanding.
It's the item position by linear indexing. Elements can be accessed using a single index, that is the position sorted by rows (base 1). f.e. The 2nd element in the 3rd row is indexed (3-1)*cols(matrix)+2
Because PTC no longer supports MATHCAD 15 and the future of getting a new license if my computer fails is in question, SMATH is a lifesaver. I am gradually converting my important files to SMATH. SMATH is a real service and excellent option for those in my situation.
I am gradually becoming accustomed to SMATH. I do have one more question on plots. If I click in an XY plot to change some formatting and I accidentally hit my mouse wheel, the plot changes the zoom level. It’s not obvious how to return to the original view. If I close the file and reopen, it is back to normal. At first I thought this was a bug, but searching the forum, I see it is a feature. Is there a simple way to return to the original view when I accidentally move my mouse wheel.
Thanks again.
WroteI am gradually becoming accustomed to SMATH.I do have one more question on plots.If I click in an XY plot to change some formatting and I accidentally hit my mouse wheel, the plot changes the zoom level.Itâs not obvious how to return to the original view.If I close the file and reopen, it is back to normal.At first I thought this was a bug, but searching the forum, I see it is a feature.Is there a simple way to return to the original view when I accidentally move my mouse wheel.
I mentioned that before, about your spoiled X_Y plot
f(x), data ... quick plot is insensitive to command wrt the graph plot.
Differently the X_Y plot will scrap the limits if you slide the graph.
Never put the mouse in the X_Y plot. Resize [X,Y] from the system.
WroteIs there a simple way to return to the original view when I accidentally move my mouse wheel.
Thanks again.
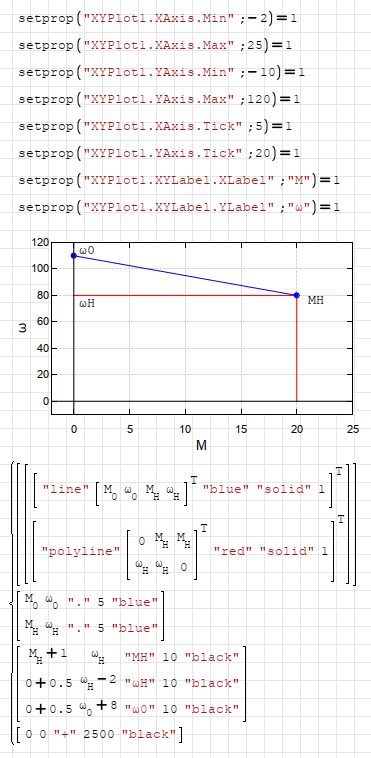
You can try to learn setprop() function for X-Y Plot.
https://en.smath.com/forum/yaf_postst1774_X-Y-Plot-Region.aspx
https://en.smath.com/forum/yaf_postsm59088_X-Y-Plot-Region.aspx#post59088
Here is a simple demonstration I posted before.
DPT_NV plot.sm (20,47 КиБ) скачан 1257 раз(а).
Regards
- Новые сообщения
- Нет новых сообщений