X-Y Plot Region

X-Y Plot Region - Extends SMath Studio with a X-Y Plot Region. - 消息

#281 已发布: 2018/8/4 02:46:31
Вячеслав Мезенцев

Вячеслав Мезенцев

1,558个赞,共1,868个帖子。

组: Moderator

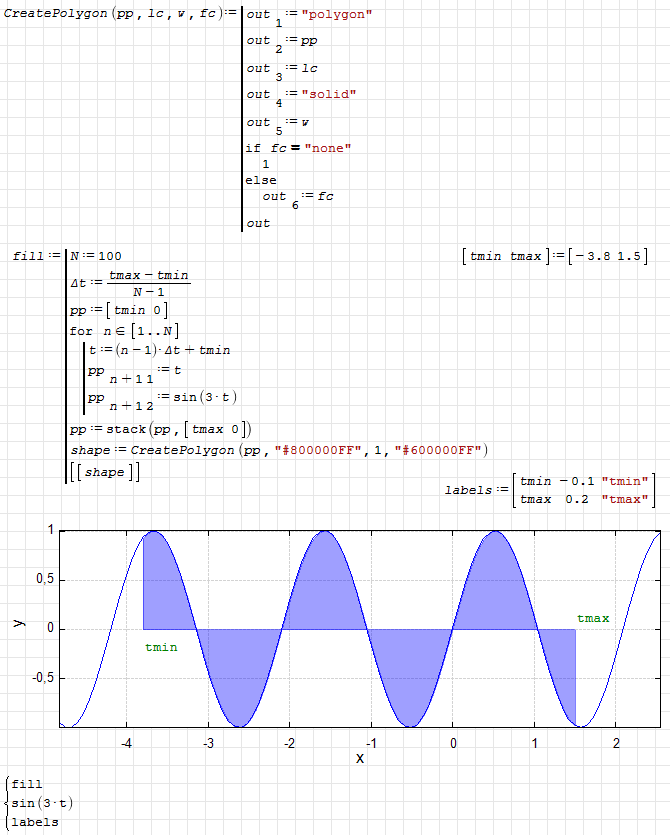
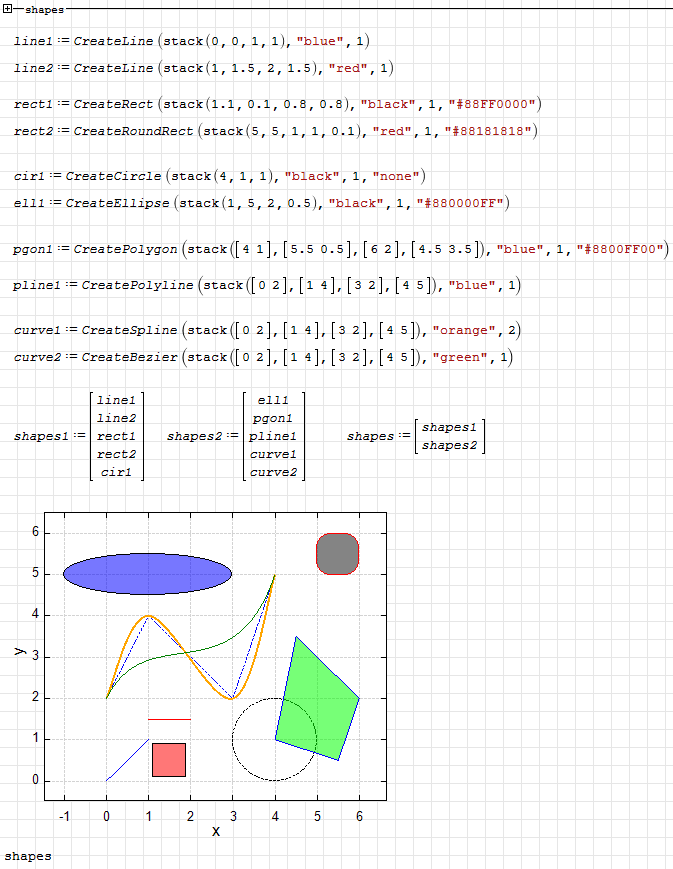
Updated. Line style for shape added. Small changes in the shape vector format.

2018-08-04_10-45-27.png

X-Y Plot. Draw shapes.sm (29.3 KiB)已下载 1439 次。
Russia ☭ forever, Viacheslav N. Mezentsev
4位用户喜欢此帖子
frapuano 2018/8/4 17:40:00, Radovan Omorjan 2018/8/4 03:37:00, Davide Carpi 2018/8/4 04:33:00, IVR 2018/8/4 06:14:00
#282 已发布: 2018/8/4 12:42:20
Вячеслав Мезенцев

Вячеслав Мезенцев

1,558个赞,共1,868个帖子。

组: Moderator

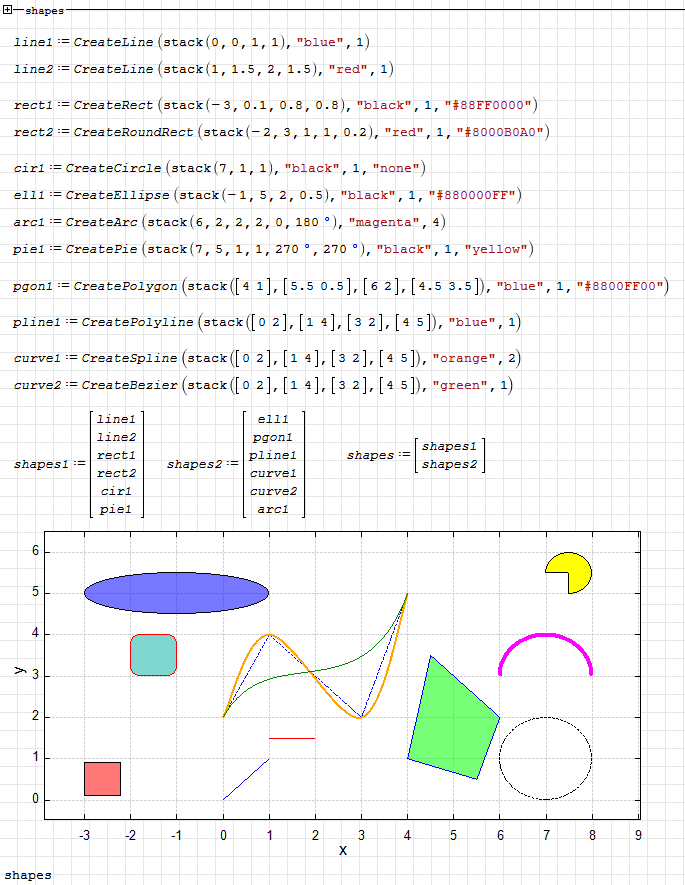
Updated. Arc and pie added, rounded rect fixed.

2018-08-04_20-41-00.png 2018-08-04_21-08-26.png

X-Y Plot. Draw shapes.sm (34.81 KiB)已下载 1471 次。
Russia ☭ forever, Viacheslav N. Mezentsev
3位用户喜欢此帖子
NDTM Amarasekera 2018/8/4 13:13:00, sergio 2018/8/4 14:28:00, Radovan Omorjan 2018/8/4 17:20:00
#283 已发布: 2018/8/4 13:14:31
NDTM Amarasekera

NDTM Amarasekera

130个赞,共352个帖子。

组: User

Thanks. How about a simple arrow?
Look within!... The secret is inside you. Best Regards Eng. NDTM Amarasekera - Sri Lanka
#284 已发布: 2018/8/4 17:37:50
Radovan Omorjan

Radovan Omorjan

325个赞和1个踩,共2,052个帖子。

组: Moderator

I saw the picture above made by uni and just remembered that many times users mentioned filling option (fill the area below the curve and x-axis) and workarounds in standard SMath plot.
When Sisyphus climbed to the top of a hill, they said: "Wrong boulder!"
#285 已发布: 2018/8/4 22:43:12
Вячеслав Мезенцев

Вячеслав Мезенцев

1,558个赞,共1,868个帖子。

组: Moderator

Wrote

How about a simple arrow?


I do not know how to do it better. The arrow should look good in different scales and in its own size.

Wrote

I saw the picture above made by uni and just remembered that many times users mentioned filling option (fill the area below the curve and x-axis) and workarounds in standard SMath plot.


Future plans:
- add a bar plot;
- add a contour plot;
- add a color map plot;
- add a vector field plot.

As for the log scale, for now I don't know how to add it without breaking the old documents.
Russia ☭ forever, Viacheslav N. Mezentsev
3位用户喜欢此帖子
frapuano 2018/8/5 05:14:00, sergio 2018/8/5 12:34:00, Radovan Omorjan 2018/8/5 02:34:00
#286 已发布: 2018/8/5 19:31:05
Jean Giraud

Jean Giraud

983个赞,共6,866个帖子。

组: User

Wrote

How about a simple arrow?


I don't see what I posted few hours ago ?

2D Util Bar Arrow.sm (23.12 KiB)已下载 1442 次。

2位用户喜欢此帖子
NDTM Amarasekera 2018/8/6 00:17:00, Вячеслав Мезенцев 2018/8/5 19:40:00
#287 已发布: 2018/8/5 22:23:12
Jean Giraud

Jean Giraud

983个赞,共6,866个帖子。

组: User

Wrote

How about a simple arrow?


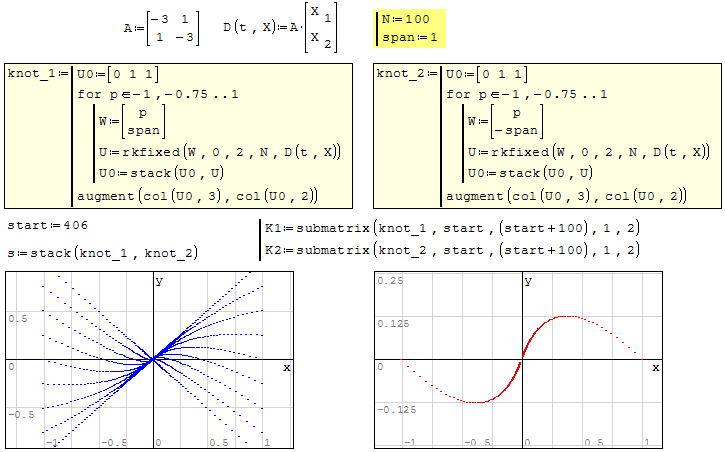
We have the Mathcad code for vector field arrow, pretty involved.
Very superb to appreciate some DE solution as it evolves.
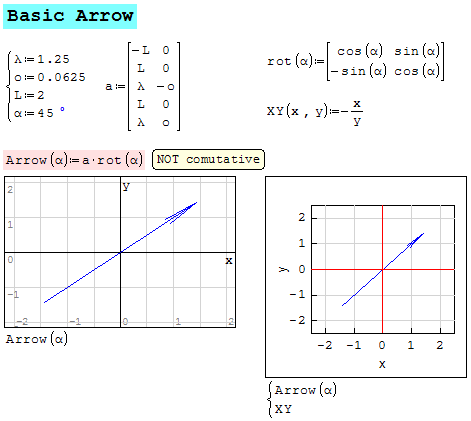
Arrow.PNG

#288 已发布: 2018/8/6 16:54:53
Вячеслав Мезенцев

Вячеслав Мезенцев

1,558个赞,共1,868个帖子。

组: Moderator

Updated. Serialization dependency for the settings form removed (changed to the experimental automatic algorithm). Legend height issue fixed. Save/load methods are significant refactored. Version changed to 0.2.x.x. Names (text representation) for the some parameters simplified (truncated).
Be careful
Russia ☭ forever, Viacheslav N. Mezentsev
#289 已发布: 2018/8/7 05:14:02
Вячеслав Мезенцев

Вячеслав Мезенцев

1,558个赞,共1,868个帖子。

组: Moderator

Wrote

The legend shows line patterns even if line visibility is set to false for the data series.
Workaround: Set the line color to transparent (see left plot).


Updated. Fixed.

Russia ☭ forever, Viacheslav N. Mezentsev
3位用户喜欢此帖子
NDTM Amarasekera 2018/8/7 05:46:00, sergio 2018/8/7 13:52:00, frapuano 2018/8/7 12:02:00
#290 已发布: 2018/8/7 11:40:24
Jean Giraud

Jean Giraud

983个赞,共6,866个帖子。

组: User

Wrote

- add a vector field plot.


VectorField.bmp
#291 已发布: 2018/8/7 17:53:46
Jean Giraud

Jean Giraud

983个赞,共6,866个帖子。

组: User

Wrote

- add a vector field plot.


VectorField.PNG
#292 已发布: 2018/8/7 18:07:37
Jean Giraud

Jean Giraud

983个赞,共6,866个帖子。

组: User

Wrote

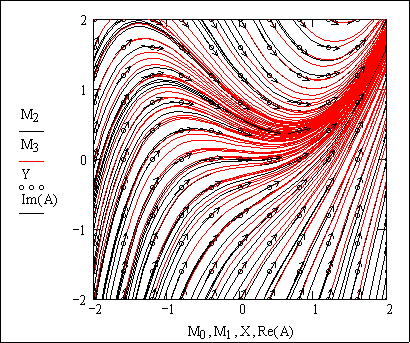
- add a vector field plot.


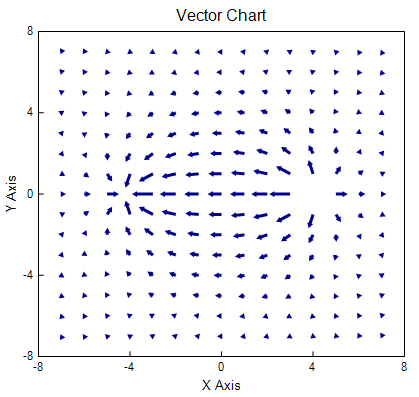
MCD arrow style on low populated field is OK.
MCD arrow style on high populated field ... just horror.
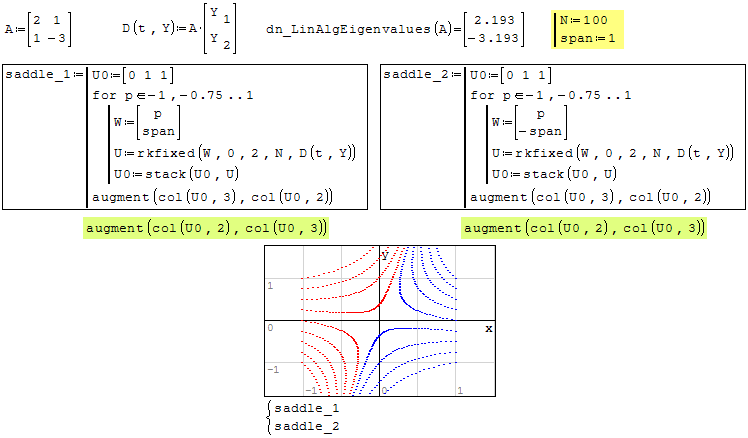
SaddleField.PNG

#293 已发布: 2018/8/8 00:19:31
Вячеслав Мезенцев

Вячеслав Мезенцев

1,558个赞,共1,868个帖子。

组: Moderator

Jean, I already have code for this:

2018-08-08_07-58-21.png

To all.

I can add more plot styles (or regions):

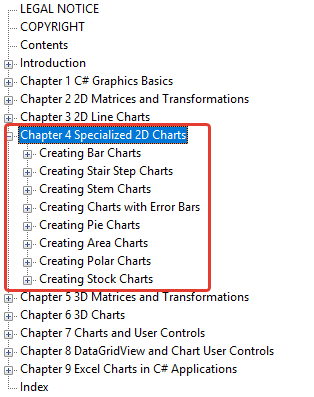
- stem, error, area, stock, stairstep, bar, countur (color mapped), vector field (these styles can be added to xyplot region);
- polar;
- pie.

All these graphs are described in the book from Jack Xu: Practical C# Charts and Graphics.
2018-08-08_08-14-14.png Practical C# Charts and Graphics.PNG

I need more time to port all of them to SMath Studio.

Now I found a way to save region settings automatically (without built in serialization). I hope that I will be able to use it in the general case. I have to change the format of saving the xyplot region settings to extend it.

You can open old versions of documents, but older versions of SMath Studio will not be able to display new documents correctly.

How do you look at such changes or what do you think about it?
Russia ☭ forever, Viacheslav N. Mezentsev
2位用户喜欢此帖子
Radovan Omorjan 2018/8/8 04:32:00, frapuano 2018/8/8 17:41:00
#294 已发布: 2018/8/8 01:39:18
Вячеслав Мезенцев

Вячеслав Мезенцев

1,558个赞,共1,868个帖子。

组: Moderator

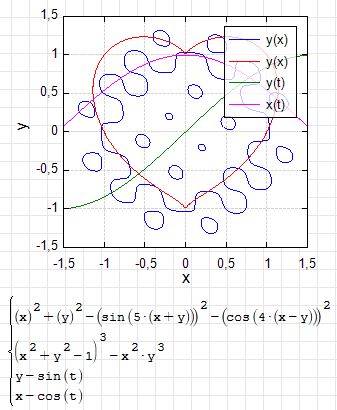
Updated. You can use simplified form to define implicit 2D plot (t or x used as first variable, for the second you can use any variable).

2018-08-08_09-35-14.png
Russia ☭ forever, Viacheslav N. Mezentsev
4位用户喜欢此帖子
sergio 2018/8/8 04:44:00, NDTM Amarasekera 2018/8/8 11:52:00, Radovan Omorjan 2018/8/8 04:31:00, frapuano 2018/8/8 02:36:00
#295 已发布: 2018/8/8 11:46:58
Jean Giraud

Jean Giraud

983个赞,共6,866个帖子。

组: User

Wrote

Jean, I already have code for this:


Thanks Uni for working all those stuff.
We still need a 3D matrix style for different usages
but mostly Catmul-Clark 3D splines and mesh.

Jean
#296 已发布: 2018/8/8 17:50:17
frapuano

frapuano

13个赞,共115个帖子。

组: User

Uni

my modest opinion is that I see as really positive the implementation of all these features/changes mentioned in your earlier e-mail ; they are really welcome even if new documents will not be displayed in old Smath version .

Best regards

Franco
#297 已发布: 2018/8/12 14:53:32
manolo

manolo

8个赞,共9个帖子。

组: User

Uni,

thank you very much for your work on X-Y Plot Region.

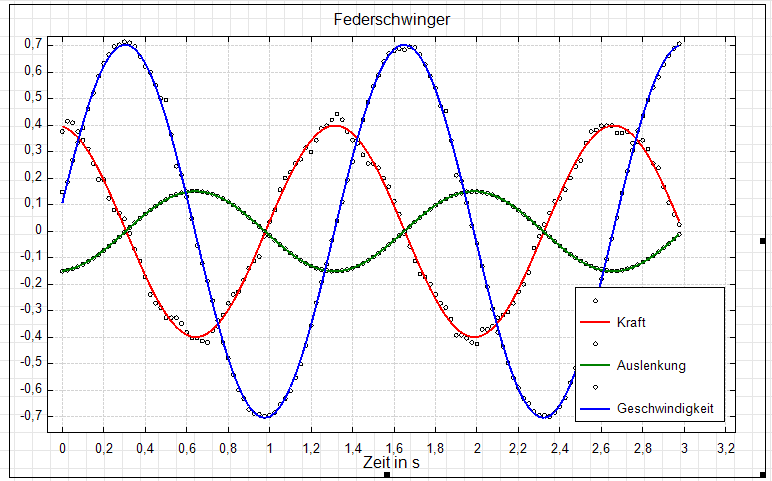
I'm plotting measured data visible as symbols and regressions as lines like this:
2018-08-12_19-32-21.png

It is possible to change the behavior of the legend? Entries without names should not be displayed in the legend.

Many thanks, Manolo
#298 已发布: 2018/8/12 20:30:56
Jean Giraud

Jean Giraud

983个赞,共6,866个帖子。

组: User

Wrote

It is possible to change the behavior of the legend?
Entries without names should not be displayed in the legend.


If you want too look smart for the reader and hide the source,
just identify "N/A: Confidential".
#299 已发布: 2018/8/12 23:52:20
Вячеслав Мезенцев

Вячеслав Мезенцев

1,558个赞,共1,868个帖子。

组: Moderator

Wrote

It is possible to change the behavior of the legend? Entries without names should not be displayed in the legend.


Updated. Try now.
Russia ☭ forever, Viacheslav N. Mezentsev
1位用户喜欢此帖子
frapuano 2018/8/13 03:59:00
#300 已发布: 2018/8/13 13:33:10
manolo

manolo

8个赞,共9个帖子。

组: User

Uni,

thank you for quick response. Plugin works as desired.
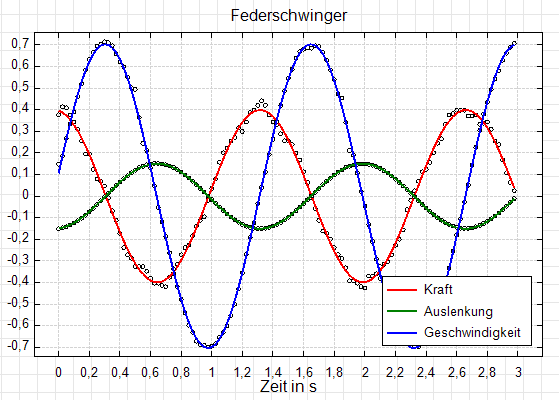
2018-08-13_18-23-51.png
de_Energieumwandlungen_Federschwinger.sm (149.55 KiB)已下载 1496 次。

Manolo
2位用户喜欢此帖子
Вячеслав Мезенцев 2018/8/14 02:15:00, frapuano 2018/8/14 03:27:00
  • 有新帖
  • 无新帖