
ZedGraph Region - Extends SMath Studio with a ZedGraph Region. - 消息

It's something like the 'Gallery' user interface but you see the effect instantly on the document when selecting an option. Then there would be a way to customize that template (axes, scales, legends, comboboxes, radiobuttons..), even a minimap to preview a number of predefined gui panels to be placed adjacent to the plot of that template (like the gui of the 3d plots from the above link).
Maybe it would be possible a way for the users to provide plot templates to the Online Gallery of SMath.
Edit:
I've seen the way MSword2010 manages plots. The problem with following completely that approach is that you hardly can trace it back to see how it works, it could be better a mix of this wizard/gallery along with a panel of simple gui controls (comboboxes,radiobuttons,checkboxes) to see "at first sight" the entire configuration of the plot in order to better understand how it is made and change it. Ideally there would be an expression updating itself so that one can see a kind of script as Martin requested.

Is there any chance to set the defaults or to set the values via script?
Is it possible to have the font size of all elements independent of region size and comparable to the math region font size (just like in xy-plot)?
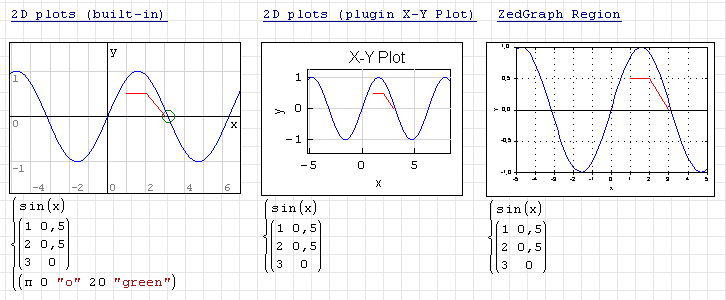
having used ZedGraph in the past because of the better formatting capabilities compared to the X-Y Plot pluging (besides Windows I am using also a Laptop with Ubuntu Linux and thus can't work with Maxima
 I was wondering when to expect an update which can be used with the latest nightly build of SMath.
By the way, recently I stumbled over a plotting software called "Veusz" which is open source and can appearently be used inside other software.
Link: http://home.gna.org/veusz/.
Could this be a candidate for a new plugin?
Martin Inäbnit
引用I was wondering when to expect an update which can be used with the latest nightly build of SMath.
Updated.

Attached is a SMath file showing a ZedGraph, but the settings are not saved after reloading.
Can somebody help me?
Test ZedGraph.sm (371.96 KiB)已下载 1778 次。
Yes, Radovan: as long as the graphic object is a two columns plotting object.
Your next visit: "Samples" ... will attach two WS about best use of X_Y plot,
damned great for plotting parametric contours !
Just slde your text and/or calucalution results in the plot, like in Smath Quick PLot.
Cheers: Jean
WroteHi,
Attached is a SMath file showing a ZedGraph, but the settings are not saved after reloading.
Can somebody help me?
Updated. Recovered.
Thank you very much. It works now.
_____________________________________
Is that what you call zgraph region ?
That reminds me the freeware "KyPlot" ~ year 2000,
was not bad but doing too little maths vs Mathcad 8 Pro.
Jean
In ZedGraph how can I convert a line graph to a smooth curve, instead of having hard corners/angles?
Something like set IsSmooth to true?

WroteOrdinal X scale [Radovan]
_____________________________________
Is that what you call zgraph region ?
I was just playing some time ago with Xaxis->Type. I am not quite sure if all of these are working well.
As far as I know, bar graphs can not be produced yet for example. Can not figure out how to put text on the X axis etc.
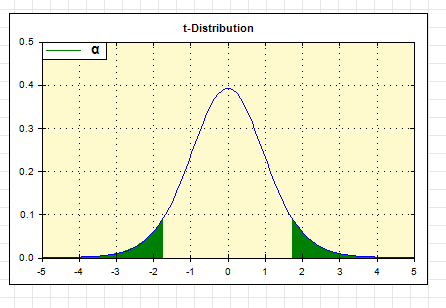
I think that uni had to use some stripped zedgraph version in SMath. Lots of options are still gray (not available)
Wrote
That reminds me the freeware "KyPlot" ~ year 2000,
was not bad but doing too little maths vs Mathcad 8 Pro.
Ah yes, I still have it on my computer. I was really amazed with KyPlot.
Unfortunately, its development stopped long time ago. Although still with bugs and rough edges, it still could be surprisingly useful.
Regards,
Radovan
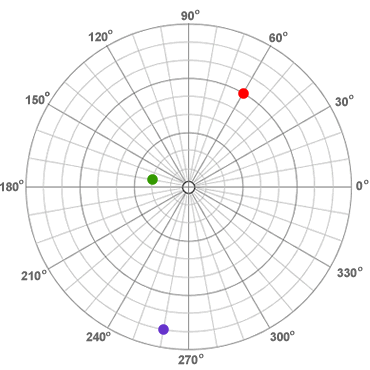
I am trying to create a polar plot by suppressing the x-y axis and replacing it with a polar grid composed of a series of concentric circles and radial lines at 30 degree intervals. To give meaning to the grid I wish to add text to indicate the radial and angular values.
Example of a typical polar plot:
I'm searching universal way to store all parameters in auto mode. I can't continue developing without this feature. xyplot has the same problem. Now I haven't time for this.
If I find out how to save parameters then I will help you with other things.

WroteIs there a way to add custom text at a defined location to a plot created using the Zedgraph plugin?
I am trying to create a polar plot by suppressing the x-y axis and replacing it with a polar grid composed of a series of concentric circles and radial lines at 30 degree intervals. To give meaning to the grid I wish to add text to indicate the radial and angular values.
I can't help wrt to your image Zedgraph, I don't have this plugin.
Visit "XY Radial Grid in Samples". Imitate polar plot, customise
the grid [colors, divisions, N circles/radii ...]
Jean
Anyways it throws an exception. I attached the text.
I'm running SMath 0.98.6522
exception.txt (6.7 KiB)已下载 1328 次。
- 有新帖
- 无新帖