Graphs Scaling

Graphs Scaling - 消息

#1 已发布: 2015/3/10 09:45:37
sperez

sperez

0个赞,共1个帖子。

组: User

Hello,

Is it possible to control the scale of the graph axes, using code within the document or an option somewhere.
I'm trying to make the scale conform to a specified domain and range so the graph generated by my functions doesn't have to be manually adjusted every time a variable is changed.


Best Regards,


Santiago

#2 已发布: 2015/3/13 15:34:48
Davide Carpi

Davide Carpi

1,443个赞,共2,936个帖子。

组: Moderator

Hello Santiago,

For precise scaling/limits you have to use a plugin, such as Maxima plugin (examples) or X-Y Plot Region

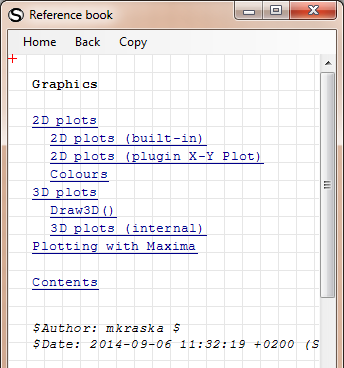
A further help is inside the extension mangager (Tools > Plugins...) > Interactive handbooks; here there is the SMath Studio Handbook, that contains a Graphics section. (You have to download it, set it to use as default, then will be available from the Help > Reference book... menu)
2015-03-13 19_38_05-Reference book.png
If you like my plugins please consider to support the program buying a license; for personal contributions to me: paypal.me/dcprojects
  • 有新帖
  • 无新帖