How to solve it? - Messages
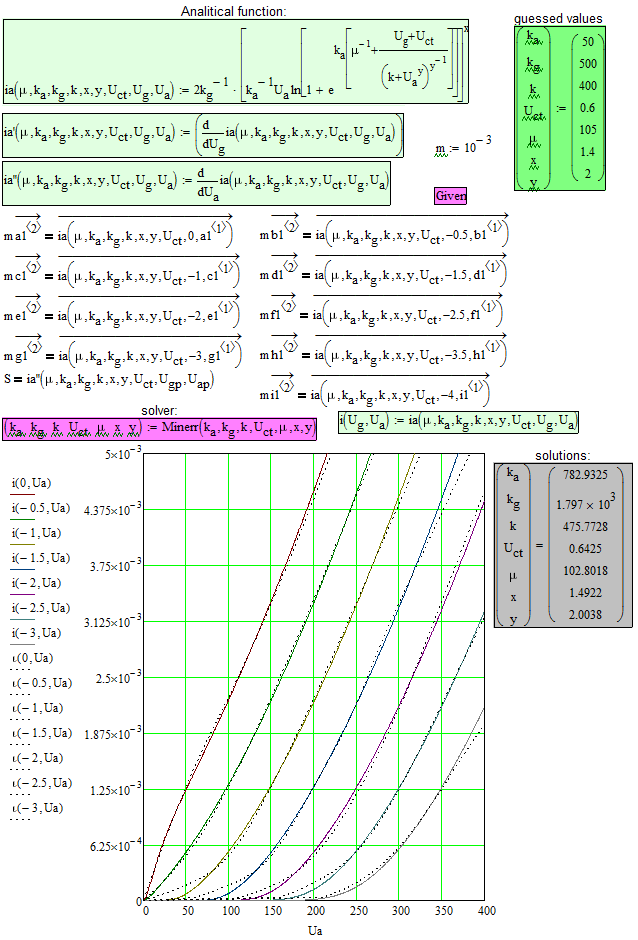
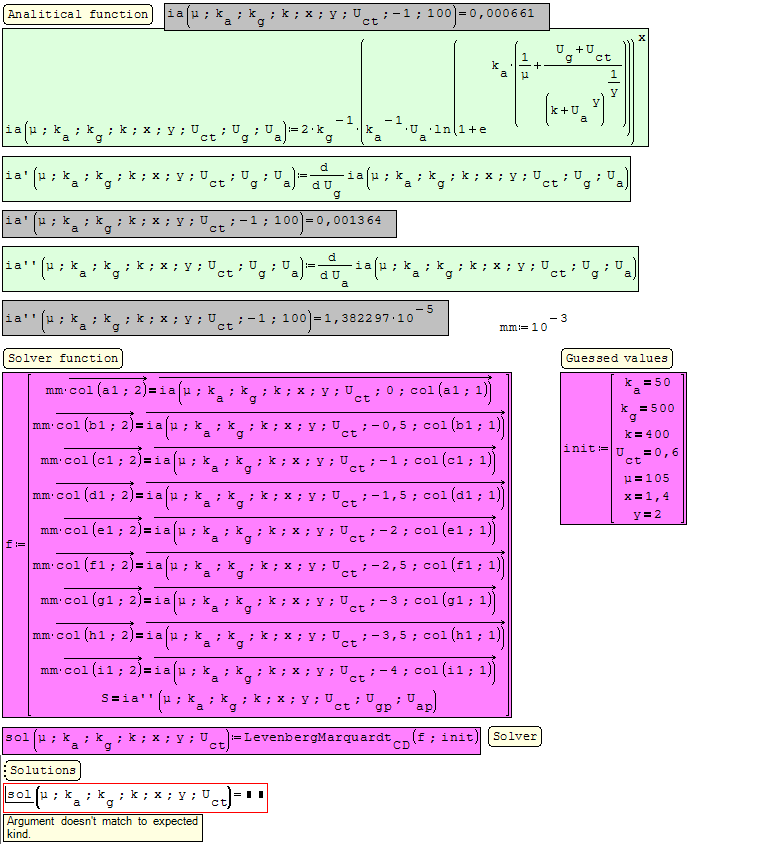
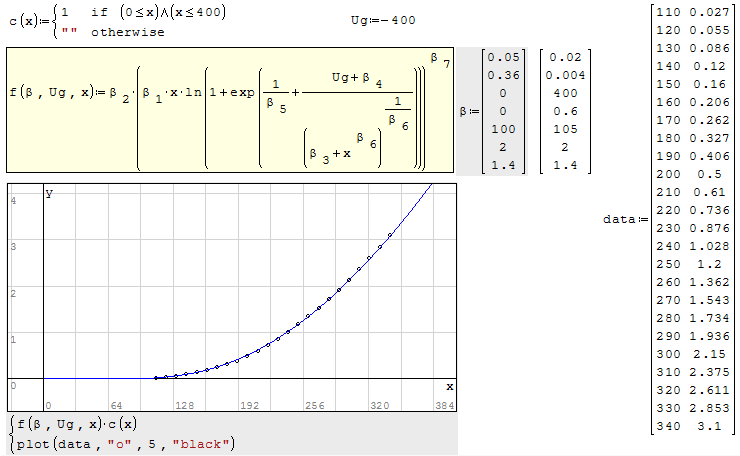
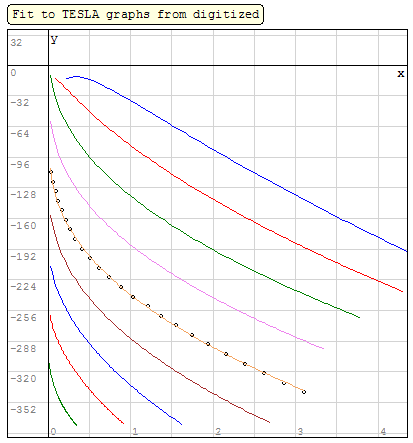
This is an attempt to approximate the physical graphical characteristics determined by the manufacturers of some electronic devices with a family of curves of an analytical function. In Figure 1 I presented a solution in MathCAD using the Given / Find block associated with the Levenberg-Marquardt method. The values of the guessed elements were determined by probing so that the curves of the analytical function (continuous colored lines) overlap as precisely as possible over the curves determined by the measurements (dotted lines). In Attachment 2, I imagined a solution by applying the same Levenberg-Marquardt method. I do not know why I got the error in the picture. Maybe someone could explain to me, or maybe already has a solution to the problem. All the best.
WroteThis is an attempt to approximate the physical graphical characteristics determined by the manufacturers of some electronic devices with a family of curves of an analytical function. In Figure 1 I presented a solution in MathCAD using the Given / Find block associated with the Levenberg-Marquardt method. The values of the guessed elements were determined by probing so that the curves of the analytical function (continuous colored lines) overlap as precisely as possible over the curves determined by the measurements (dotted lines). In Attachment 2, I imagined a solution by applying the same Levenberg-Marquardt method. I do not know why I got the error in the picture. Maybe someone could explain to me, or maybe already has a solution to the problem. All the best.
============================
The Mathcad/Mathsoft block Given/Find, Minerr, Minimize, Maximize is a proprietary wrapup
of Numerical Recipes. No such thing is even close in Smath. Further, few of the parameters
in your Mathcad image are from the blue and no data set. Up until now: can't help.
On the other hand, I have 70 Smath work sheets optimizing model function(s) wrt to
data set, based on Conjugate Gradient, iterated manually.
If you are willing, post ONE [only one] data set c/w no parameters from the blue.
Genfit Minimize Power Model.sm (30.03 KiB) downloaded 1007 time(s).


If you hardly have two fits, then the model is incorrect.
Genfit [NOT Done xo Exp].sm (33.87 KiB) downloaded 833 time(s).... suggestive
Here is an applicable file. In this case, all variables (μ, ka, kg, k, x, y, Uct) are positive according to the results obtained in MathCAD. The Ug and Ua variables are control parameters. Ug takes values between -4 and 0. Ua takes values between 0 and 300. The sizes I have inadvertently deleted have the values: S = 0.0016, Ugp = -2 and Uap = 250. I apologize for the inconvenience.
LM.sm (61.23 KiB) downloaded 992 time(s).
Wrote... according to the results obtained in MathCAD.
OK ! but you have nothing worth from Mathcad, looking at the plots.
1. Your model function looks to complicated if it would work.
2. Intuitively, it would be Given/Find ... NOT Given/Minerr.
3. ... and the derivative would have nothing to do in there.
============================================================
Tentatively, I have fitted two data sets.
Don't forget your data sets are from foreign source, thus just "data".
If you just want to fit all data sets, please confirm, give me two days.
I have no idea how each one is headache !
The concept of "bing/bang/auto/done ... " is BS IMHO [In My Humble Opinion].
Jean
OlaNicolas.sm (42.05 KiB) downloaded 975 time(s).
I wrote "Given / Find" in the first post. It's actually "Given / Minerr". I'm sorry for the inconvenience. Check out my previous post. I mentioned some data that I accidentally deleted from the previously attached file. The partial derivative of the function (ia) takes in relation to Ua, it is necessary to achieve the slope of the curves, the S-dimension being an important parameter of the electronic devices in question. Now I will analyze your file.
WroteHello Jean Giraud.
I wrote "Given / Find" in the first post. It's actually "Given / Minerr". I'm sorry for the inconvenience. Check out my previous post. I mentioned some data that I accidentally deleted from the previously attached file. The partial derivative of the function (ia) takes in relation to Ua, it is necessary to achieve the slope of the curves, the S-dimension being an important parameter of the electronic devices in question. Now I will analyze your file.
=================================
Nick,
You have 9 data sets, what do you want to with them ?
Mathcad does nothing visible, Smath will do less or nothing.
I have 3 data sets left to fit for tonight.
'a1' looks monkey business ... maybe too long ?
Cheers ... Jean
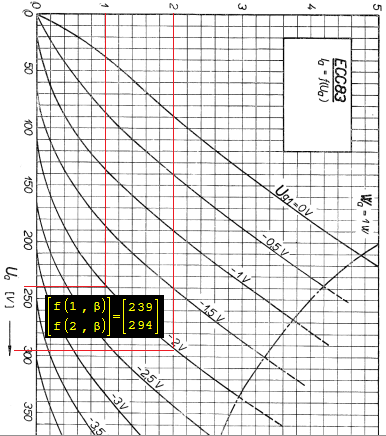
One of the many datasheets of the electronic device in question can be found here: http://www.datasheetspdf.com/pdf-down/E/C/C/ECC83-TESLA.pdf The graphic features I am talking about are on page 12 of the document. The array of data arrays a1, b1, ..., i1 has been sampled by sufficiently accurate methods following those characteristics. My purpose is to determine an applicable set of μ, ka, kg, k, x, y and Uct parameters of the analytical function so as to approximate as accurately as possible those characteristics. I know that SMath may be less than MathCAD, but I would like to find even a less extensive method to achieve approximation. That's why maybe only 5 of the 9 data arrays could be used. Or perhaps even some less epaining methods would be found.
Cheers, Nick.
WroteHello.
One of the many datasheets of the electronic device in question can be found here: http://www.datasheetspdf...wn/E/C/C/ECC83-TESLA.pdf The graphic features I am talking about are on page 12 of the document. The array of data arrays a1, b1, ..., i1 has been sampled by sufficiently accurate methods following those characteristics. My purpose is to determine an applicable set of μ, ka, kg, k, x, y and Uct parameters of the analytical function so as to approximate as accurately as possible those characteristics. I know that SMath may be less than MathCAD, but I would like to find even a less extensive method to achieve approximation. That's why maybe only 5 of the 9 data arrays could be used. Or perhaps even some less epaining methods would be found.
Cheers, Nick.
Oh ! my goodness ... your data sets are reversed ordered.
You have X in col[2] ,,, Y in col[1]
I guess it will fit easier +++ zap all zeros [what are they doing in there ?
OlaNicolas(1).sm (101.95 KiB) downloaded 951 time(s). ... in the mean time.
WroteOh ! my goodness ... your data sets are reversed ordered.
You have X in col[2] ,,, Y in col[1]
I guess it will fit easier zap all zeros [what are they doing in there ?
==========================
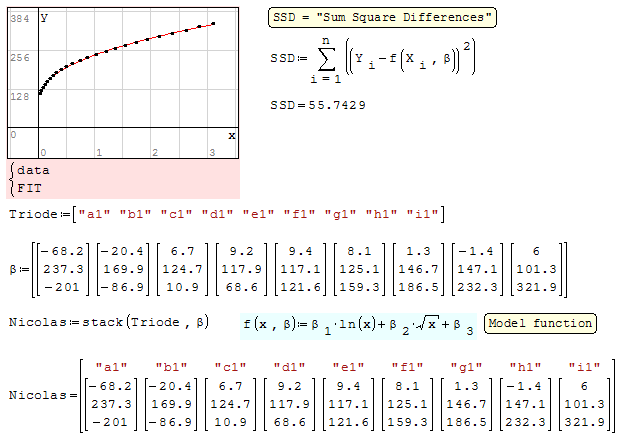
Once the data sets are ordered and stripped from zeros, < 1 min job fit .
Jean
Genfit Minimze Nicolas.sm (70.33 KiB) downloaded 933 time(s).
Wrote...Oh ! my goodness ... your data sets are reversed ordered.
You have X in col[2] ,,, Y in col[1]...
Hello.
The data is not reversed. Look better at the original chart. On the abscissa are the anodic voltages, while the anodic currents are on the order. Correspondingly we have tensions in the first column and currents in the second. Now looking at your chart, you will see that it is symmetrical with the first bisector of the axes, that is, the opposite of the original one.
WroteHello.
The data is not reversed. Look better at the original chart. On the abscissa are the anodic voltages, while the anodic currents are on the order. Correspondingly we have tensions in the first column and currents in the second. Now looking at your chart, you will see that it is symmetrical with the first bisector of the axes, that is, the opposite of the original one.
======================
Nick,
Read the other way around: TESLA is walking on the head ... Smath Descartes walk on feet !
TESLA graphs were done by hand [1959], from analog equipment ... just put on graph paper
and done by French Curves. OK well drawn and well digitized. The model function prposed
looks more than valid. From the residuals, you can see the French Curves arcs. This is
obvious because the model function is purely monotonous.
Flip the PC screen up side down to see TESLA graphs.
OBSERVE: the model function is robust wrt Conjugate Gradient, a single set of initials.
Thus, the system could be done recursively for all the data sets [not offered].
Genfit Minimze Nicolas.sm (198.61 KiB) downloaded 1004 time(s). ... refreshed
Your skill in developing mathematical models is remarkable and I sincerely appreciate it as such. The big problem is that when I use a mathematical regression in a simulator to model a set of features like those I mentioned, I have a simple script to introduce this regression like Ia = 0.001113 * (0.001277 * v ( 2.4) * ln (1 + 2.718282 ^ ((782.9 * v (1.4) +503.05) / (V (2,4) + 2.004 475 783 ^) ^ 0.499 + 7.6159))) ^ 1.4922 where Ia is the function, and v (1,4) and v (2,4) are the variables. If you can tell me how I can enter a matrix array variable (such as β) into such a script then accept the solution. Otherwise, I would like to stick to the analytical function that I put in the pictures in the first post. If you have enough experience to change it in order to increase the precision of the results, this could be beneficial. The relationship I have written in the first post is one that has been developed over time by more passionate electronics professionals and / or amateurs. Based on this, electronic tubes could be loaded onto modern electronic simulators. The problem is to be able to determine sets of specific factors for each device. A similar relationship exists for pentodes, this relationship being for triodes. So let's try to determine the specific factors ka, kg, k, Uct, x, y, μ for that relationship. This is the purpose of this topic.
Wrote... ... If you can tell me how I can enter a matrix array variable (such as β) into such a script then accept the solution. Otherwise, I would like to stick to the analytical function that I put in the pictures in the first post. If you have enough experience to change it in order to increase the precision of the results, this could be beneficial. The relationship I have written in the first post is one that has been developed over time by more passionate electronics professionals and / or amateurs. Based on this, electronic tubes could be loaded onto modern electronic simulators. The problem is to be able to determine sets of specific factors for each device. A similar relationship exists for pentodes, this relationship being for triodes. So let's try to determine the specific factors ka, kg, k, Uct, x, y, μ for that relationship. This is the purpose of this topic.
I understand all what you are after, I graduated in Electronics about 58 years ago.
True, the best vacuum tubes of this times were from Romania !
Up until now, the project is like pushing the greasy round pig in the square hole.
1. Set the digitizer correctly so to have some typical data set of the format you
are showing in Mathcad.
2. Make sure there is no zero's, because I will have to strip them again.
3. The "savant passionate" function is as simple as any other, just more involved.
4. Not so sure such complexity is required ... that's why at least one data set is
needed to experiment ... Don't worry: give them all the 9 ones in concern.
5. Mathcad may be able to digest this 7 parameters formula For Smath, it will be
quite a challenge because up until now: limited to Conjugate Gradient.
See you soon
Page0 Nicolas Formula.sm (7.82 KiB) downloaded 1189 time(s).
Wrote... True, the best vacuum tubes of this times were from Romania ...
Hi Jan Giraud.
Romania has produced only CRT tubes, which I do not know if it still produces them today. The electronic tube apparatus was produced until 1976. The necessary electronic tubes were imported from Czechoslovakia, Hungary, Germany, the Netherlands, but mostly from the USSR. After 1976, the entire production has passed on semiconductor devices, which have begun to be manufactured in Romania since the 1960s. As far as the MathCAD valences are concerned, I know them pretty well. I would have liked to be able to do at least in SMath what could be there. Thanks a lot for all the help.
Cheers.
WroteI would have liked to be able to do at least in SMath what could be there. Thanks a lot for all the help.
Don't get discouraged. I will test some more
Can't presume if Smath will digest ?
Your formula looks overkilled ... too many parameters.
WroteI would have liked to be able to do at least in SMath what could be there.
Nicolas,
That's what you have attached. One of many fitting techniques, is data reduction
That's what you have in the recovered from all β's calculated separately.
Your proposed model ln(exp(,)) is not digestible for Conjugate Gradient.
As it looks, neither it is in Mathcad from the crappy fit you showed.
You can have it manually, but nothing any better than the model offered.
The TESLA model in Genfit Minimize Nicolas can be set recursively to collect
all β's at once for the "Recover" page ... this one too can be set recursively.
All in all, Smath can automate quitea few of those Triodes you want to digitize
for the generations.
Page1 Nicolas Formula.sm (42.44 KiB) downloaded 1215 time(s).
Page1 Nicolas TESLA Model Recover.sm (185.35 KiB) downloaded 1036 time(s).
Genfit Minimze Nicolas.sm (203.29 KiB) downloaded 1003 time(s).
WroteThe relationship I have written in the first post is one that has been developed over time by more passionate electronics professionals and / or amateurs.
Excellent observation, but fitting a model to experimental data is not always done.
here is a list of never done by the "Grand Savants"
1. Hanhn [1,2] muffed by NIST
2. Carbon 12 muffed by Matlab
3. Thermocouples [J,T] only piece wise by NIST ... simply muffed.
4. Pt 100 [Platinum Resistance Thermometer] never done since 1887
5. Ant Colony ... muffed by Amaerican Scientific.
6. US rainfall muffed
Just a comment. Cheers Nicolas.

- New Posts
- No New Posts