How to plot a polar diagram of radiated fields of infinitesimal linear wire - Messages
how to plot a polar diagram of radiated fields of infinitesimal linear wire?
Could you plase help me with this topic.
Bes regards,
Andrey
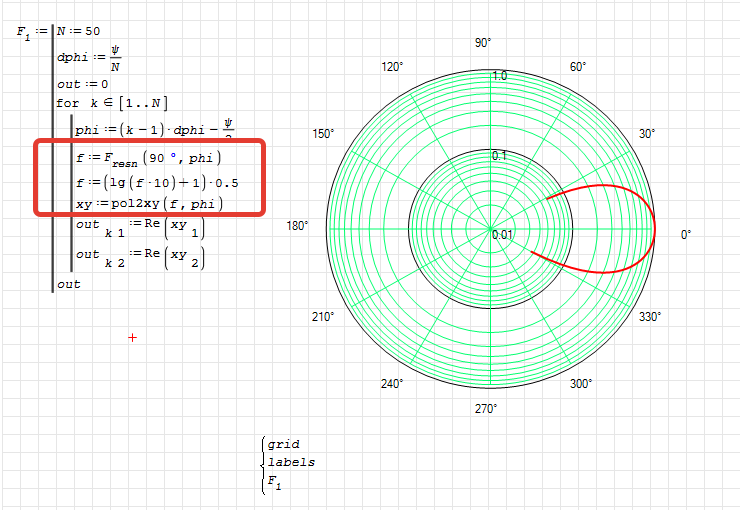
Please see you the file Herzt_Dipole_Polarediagram.sm (328.05 KiB) downloaded 1127 time(s).
![2021-10-18 13_42_56-SMath Solver - [Herzt_Dipole_Polarediagram.sm_].png](/en-US/files/Download/BGWbcY/2021-10-18-13_42_56-SMath-Solver---[Herzt_Dipole_Polarediagram.sm_].png)
Herzt_Dipole_Polarediagram_Kr.sm (473.09 KiB) downloaded 1158 time(s).
Wrote... Sorry for the high resolution screenshot, this seems to be a new feature of the smath solver or some other dpi glitch on my system (the screen was not high dpi where the shot was taken from, however). ...
Hi Martin. After I post several images in very poor resolution I think the best option is to capture the images in SMath with the zoom set to 70% or something similar to obtain decent images.
Best regards.
Alvaro.
I have another question:
1. how to plot the directions theta=0...180 and phi=0...360 on the polar diagrams?
2. how to plot log scale for the functions? I need to map the dB(Radiation_Pattern) like in Mathcad.
Is there a solution here, or snippes, or plugins?
Calculation of the corner antenna.sm (415.54 KiB) downloaded 1196 time(s).
Best regards,
Andrey
WroteThanks for all, for their comments.
I have another question:
1. how to plot the directions theta=0...180 and phi=0...360 on the polar diagrams?
2. how to plot log scale for the functions? I need to map the dB(Radiation_Pattern) like in Mathcad.
Is there a solution here, or snippes, or plugins?
Calculation of the corner antenna.sm (415.54 KiB) downloaded 1196 time(s).
Best regards,
Andrey
Hello Smath users,
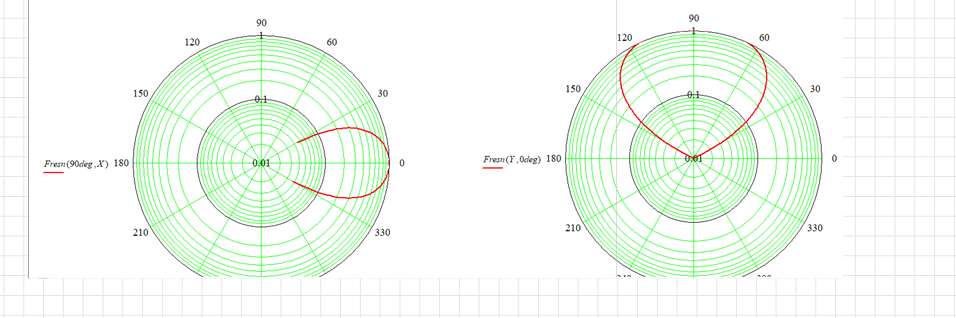
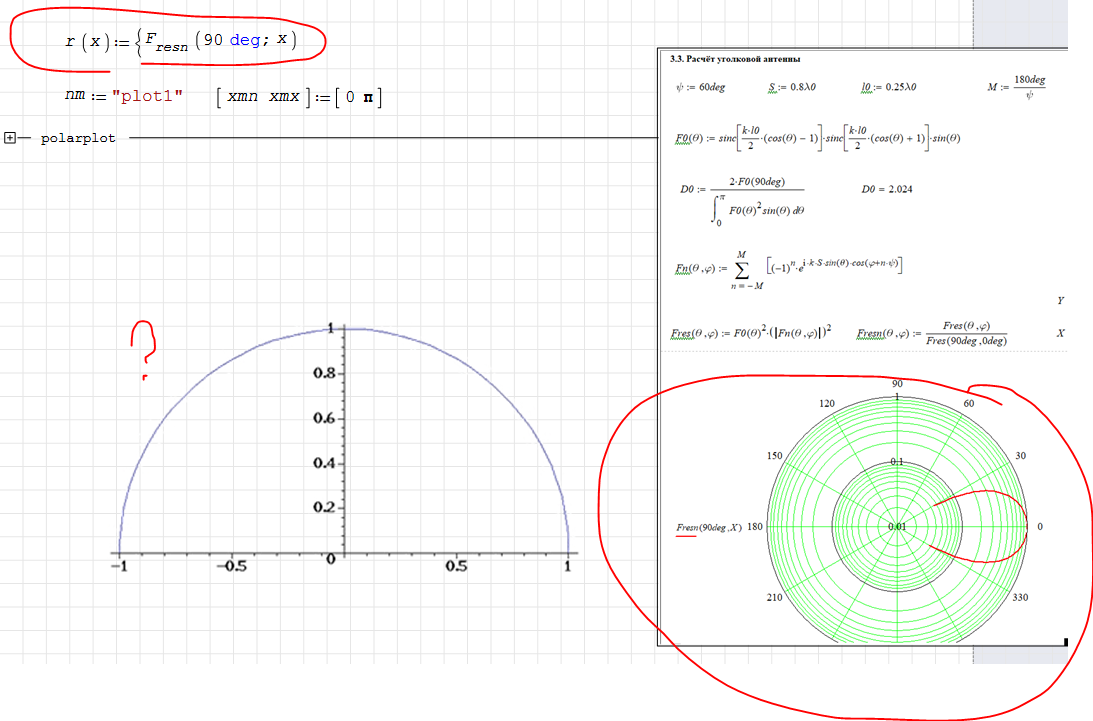
do you have experience or any idea, who to create a polar plot like Mathcad, as shown on the picture?
I need a dB or Log - scale for radius and marking of directions
Thank you for you help.
Best regards,
Andrey
WroteHello Smath users,
do you have experience or any idea, who to create a polar plot like Mathcad, as shown on the picture?
I need a dB or Log - scale for radius and marking of directions
Thank you for you help.
Best regards,
Andrey
I remember Viacheslav has introduced a polarplot example with maple plugin.
Maybe that demonstration can be a starting point for you.
Regards
Link to file:
https://smath.info:8443/svn/public/!svn/ver/3317/plugins/MapleTools/Examples/mapletools.polarplot.sm
unfortunately I did not succeed to create the graph as polar diagram with the help of Maple plugin.
I have tried different options, with Maxima plugin it works, with Maple unfortunately not.
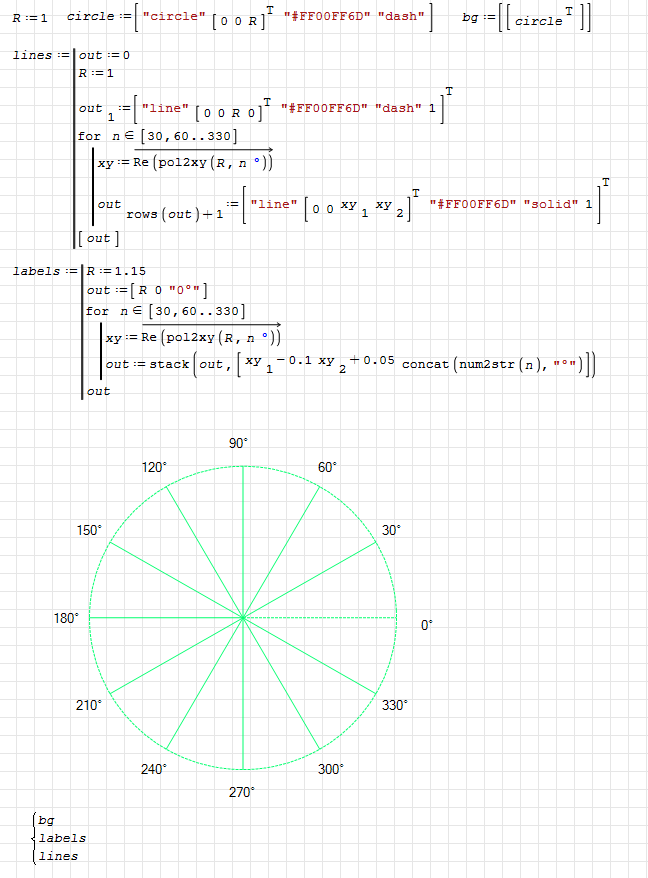
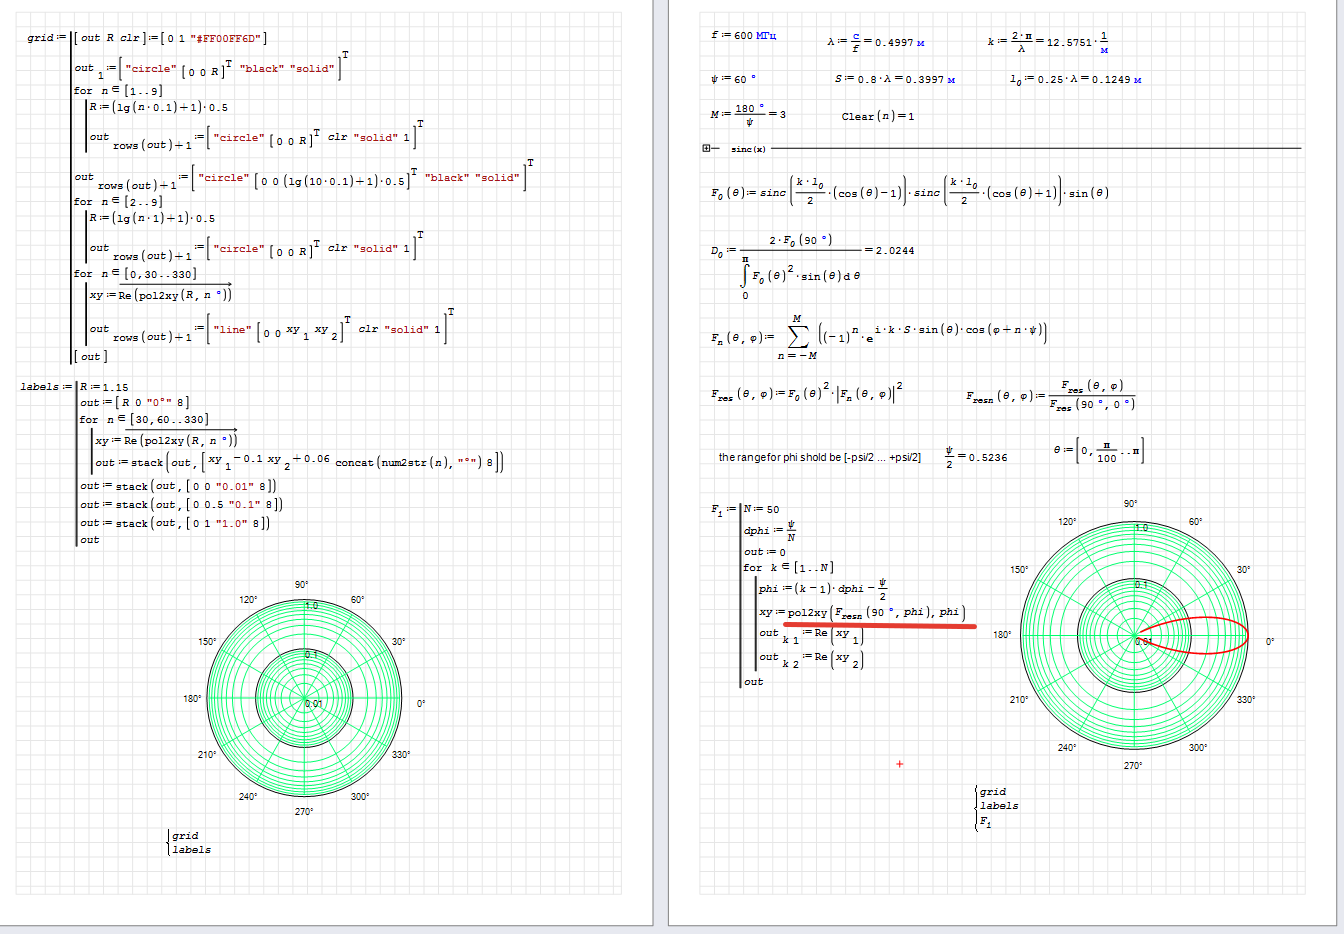
Just one thing. How can I create the polar lines and circular lines (dB or Log20 or Log10) with different step sizes?
A desirable is the one polar diagram as on the picture Calculation of the corner antenna.sm (423.36 KiB) downloaded 1079 time(s).
That is unfortunately a pity that there is not available a Polar-Diagram set s a normal tool or plugin.
Best regards,
Andrey

XYPlot. Shapes. Polar grid.sm (11.58 KiB) downloaded 1088 time(s).
XYPlot. Draw shapes.sm (19.85 KiB) downloaded 2841 time(s).
XYPlot. Draw shapes.pdf (92.91 KiB) downloaded 1918 time(s).
XYPlot. Shapes. Polar grid.sm (34.66 KiB) downloaded 1073 time(s).
С наилучшими пожеланиями,
Андрей
XYPlot. Shapes. Polar grid.sm (38.47 KiB) downloaded 1018 time(s).
XYPlot. Shapes. Polar grid.pdf (124.28 KiB) downloaded 637 time(s).
мне все еще нужно обратиться к вам за помощью с Log-Polar Plot.
Я столкнулся с проблемой, как сделать полярный график с логарифмической шкалой для Theta.
Я всегда вижу отрицательное значение r в начале и в конце спискса.
Мне пришлось провести нормализацию и проверки амплитуды на отрицательный радиус перед взятием логарифма, но это не помогло.
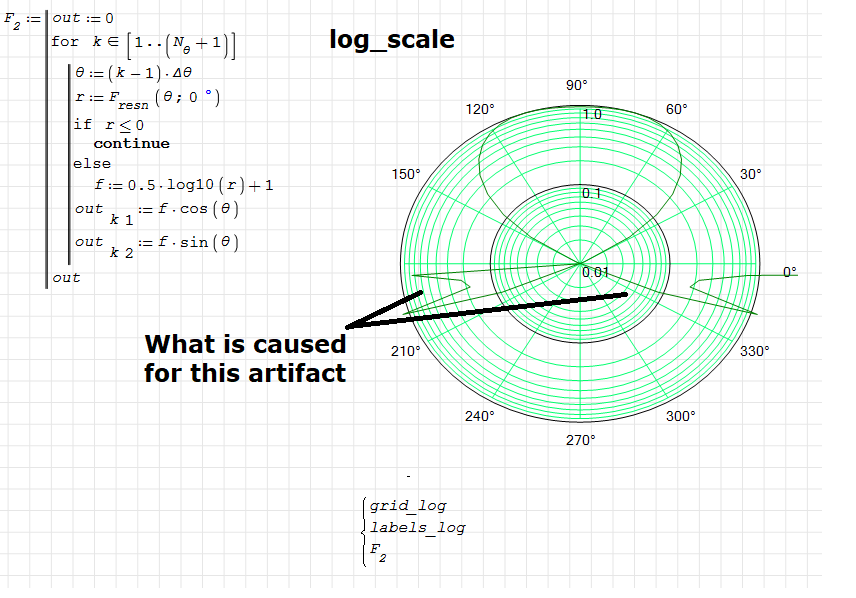
Как по Вашему, что может быть причиной такого поведения для графика по углу Theta?
Calculation of the corner antenna_2.sm (499.88 KiB) downloaded 1170 time(s).
Спасибо, Андрей
Wrote... refreshed, angle of max radiation added.
Project Dipole.sm (47.29 KiB) downloaded 1053 time(s).
Hi Jean,
thank you for your help. There are interesting and original solutions in your post. I'll take note of them.
Best regards,
Andrey
File not found. File not found. File not found.
С уважением,
Андрей
WroteМожно так.
There is there a very mysterious r> 0.01. My explanation is that, first of all, you have to make sure that the argument for log10 is positive, but then you have to verify that in the polar graph it is f> 0, because in polar coordinates only positive values of the position vector module are considered. This implies that f = 0.5 * log10 (r) +1> 0 is needed, from which solving for r we have the mysterious condition r> 0.01.
Best regards.
Alvaro.
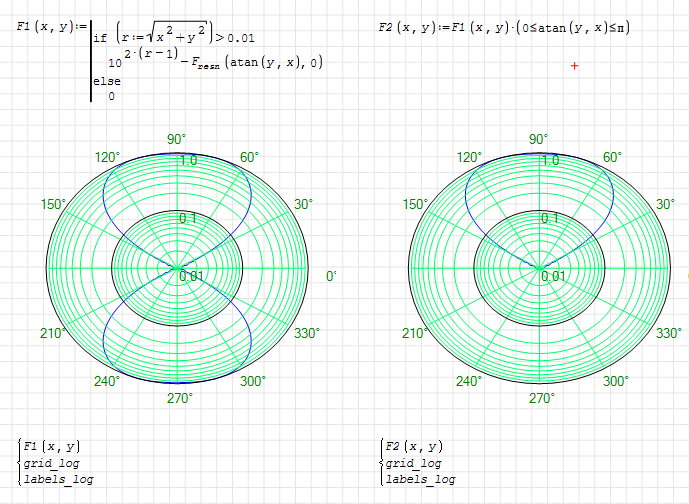
Addendum:
The original range for the graph is 0 < theta < 180º . Outside of that domain the problem is not defined, or simply does not matter. Viacheslav restricted the domain by imposing y> 0, which is correct, but the following form shows a little more clearly how the transformation of coordinates from Cartesian to logarithmic polar is done, and then imposing the original condition on the domain, so that XY plot just plot in the desired range.
- New Posts
- No New Posts